Fig. 4.
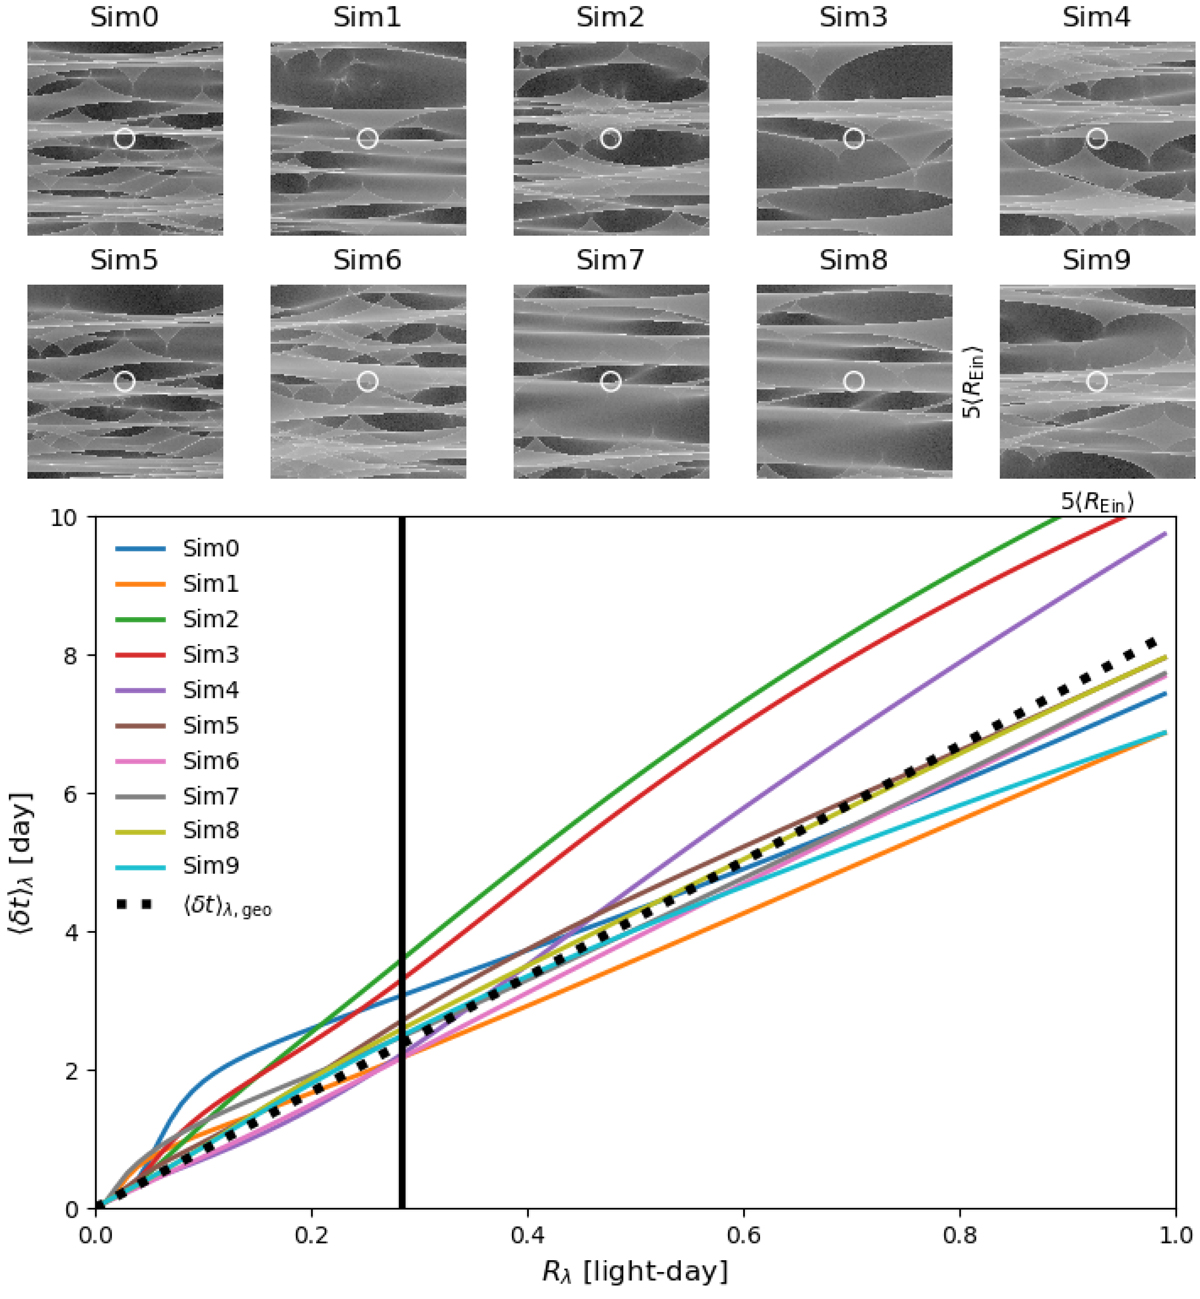
Top: examples of magnification patterns spanning each 5⟨REin⟩, assuming the IMF ⟨M⋆⟩ = 0.3 M⊙ and r = 100. Bottom: source size Rλ and mean delay ⟨δt⟩λ for each realization of the magnification pattern. The dotted line in black corresponds to the relation without microlensing, i.e. the geometric delay. The white circles in the top panels represent the effective radius 5.04(1 + zS)Rλ = 2.315 light-day, and the vertical black line in the bottom panel indicates Rλ = 0.277 light-day (see text).
Current usage metrics show cumulative count of Article Views (full-text article views including HTML views, PDF and ePub downloads, according to the available data) and Abstracts Views on Vision4Press platform.
Data correspond to usage on the plateform after 2015. The current usage metrics is available 48-96 hours after online publication and is updated daily on week days.
Initial download of the metrics may take a while.