Fig. 3.
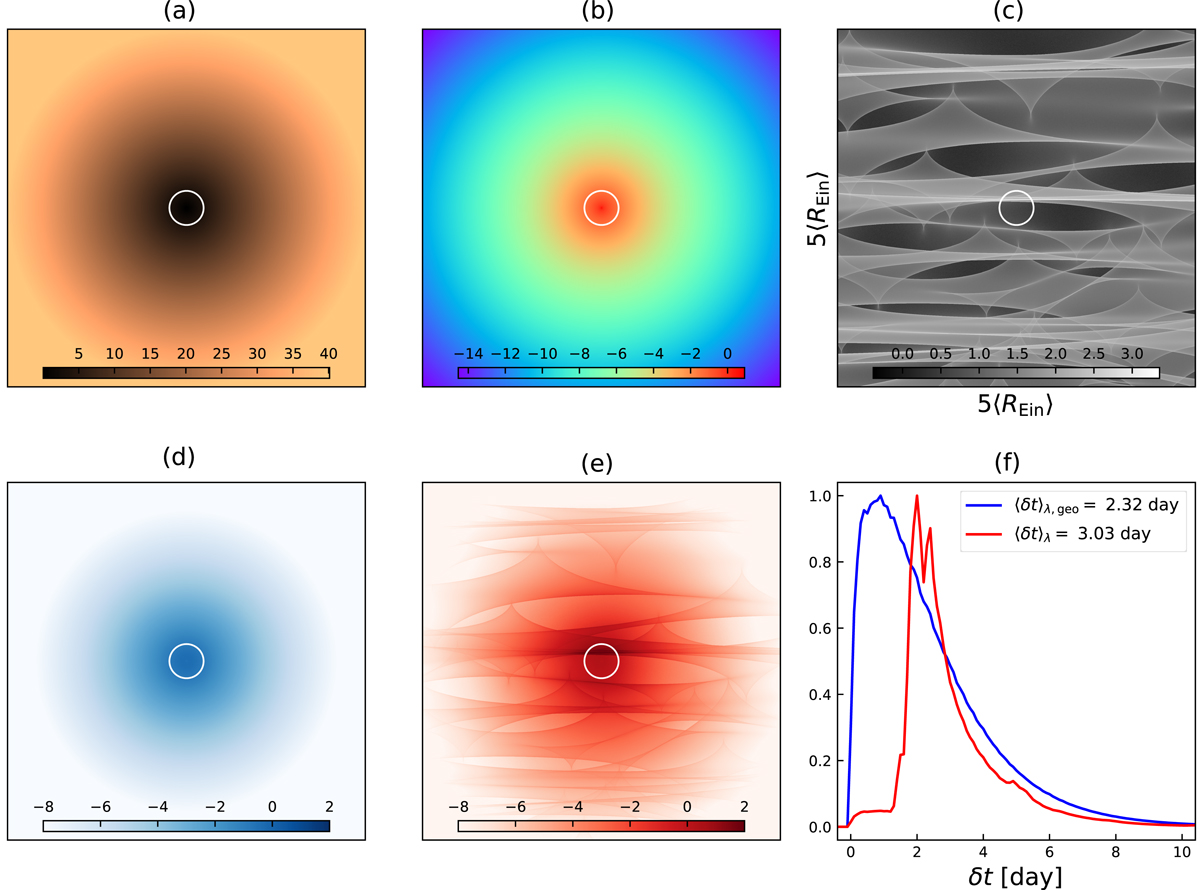
Illustration of the distortion of the probability distribution of time delays with and without the microlensing effect. Panel a: geometrical time lag of the disk, which is simply ![]() , when the disk is seen face-on; panel b: luminosity profile Gλ with Rλ = 0.277 light-day; and panel c: zoom-in of 5⟨REin⟩ magnification pattern using ⟨M⋆⟩ = 0.3 M⊙, r = 100. Panels d and e: time lag weighted by Gλ and Gλ ⋅ μ, respectively. Panel f: compares the net effect of microlensing on the time delay distribution we would obtain without microlensing. The white circle in each color map is labeled with the effective radius 5.04(1 + zS)Rλ = 2.315 light-day. (a) δt [day]. (b) log Gλ. (c) log μ. (d) log(δt ⋅ Gλ). (e) log(δt ⋅ Gλ ⋅ μ). (f) Probability of delay.
, when the disk is seen face-on; panel b: luminosity profile Gλ with Rλ = 0.277 light-day; and panel c: zoom-in of 5⟨REin⟩ magnification pattern using ⟨M⋆⟩ = 0.3 M⊙, r = 100. Panels d and e: time lag weighted by Gλ and Gλ ⋅ μ, respectively. Panel f: compares the net effect of microlensing on the time delay distribution we would obtain without microlensing. The white circle in each color map is labeled with the effective radius 5.04(1 + zS)Rλ = 2.315 light-day. (a) δt [day]. (b) log Gλ. (c) log μ. (d) log(δt ⋅ Gλ). (e) log(δt ⋅ Gλ ⋅ μ). (f) Probability of delay.
Current usage metrics show cumulative count of Article Views (full-text article views including HTML views, PDF and ePub downloads, according to the available data) and Abstracts Views on Vision4Press platform.
Data correspond to usage on the plateform after 2015. The current usage metrics is available 48-96 hours after online publication and is updated daily on week days.
Initial download of the metrics may take a while.