Fig. 2.
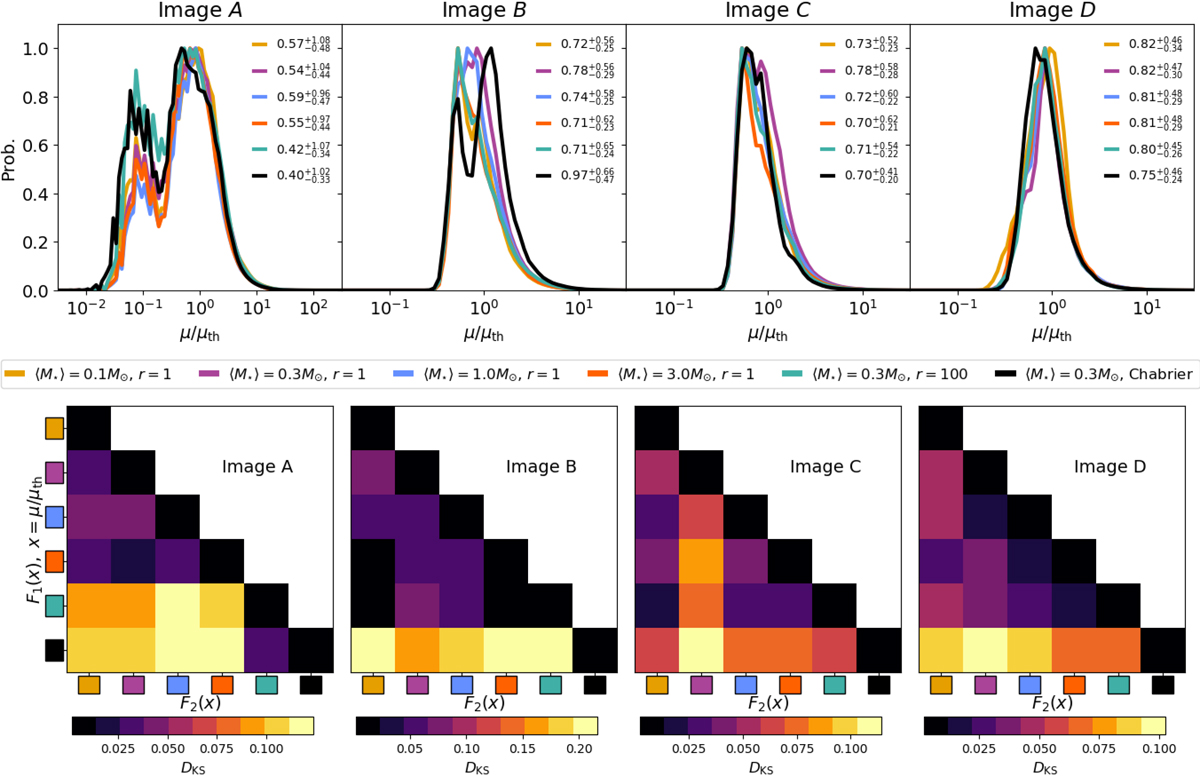
Top: magnification probability distribution of each lensed image, i.e. the histogram of the pixels in the maps (see Fig. 1). Bottom: Kolmogorov–Smirnov statistic of each distribution pair (see Eq. (3)). In each case, the corresponding μ is indicated in the middle. The Salpeter and Chabrier mass functions have slightly deviated distributions. Small DKS shows that the probability distributions are insensitive to the chosen mean stellar mass or IMF, but they are not independent of them.
Current usage metrics show cumulative count of Article Views (full-text article views including HTML views, PDF and ePub downloads, according to the available data) and Abstracts Views on Vision4Press platform.
Data correspond to usage on the plateform after 2015. The current usage metrics is available 48-96 hours after online publication and is updated daily on week days.
Initial download of the metrics may take a while.