Free Access
Fig. A.2.
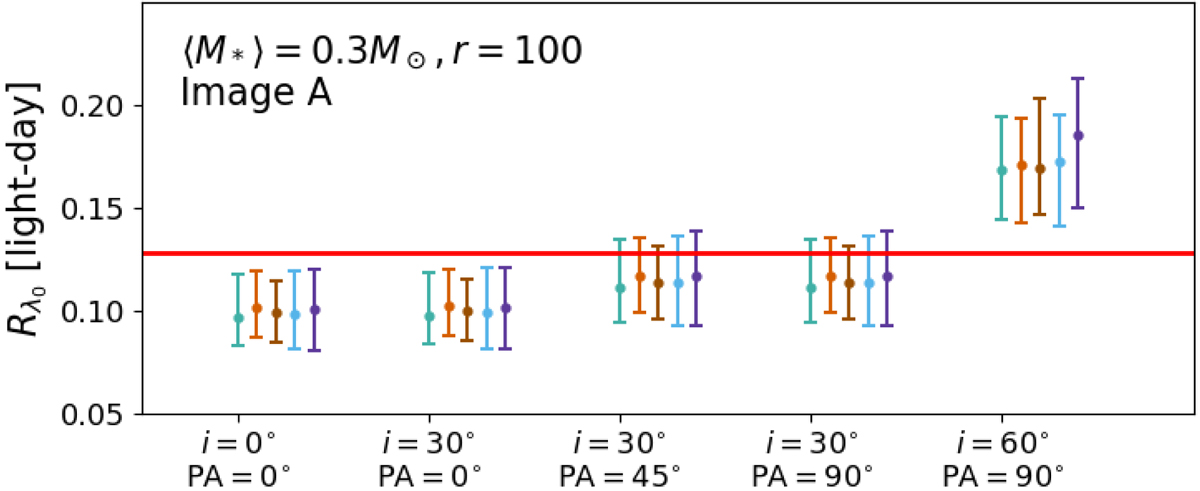
Source measurement of Image A with different inclinations (i) and position angles (PA) of disk configuration. For each simulation, we employed five realizations of the template magnification map to measure the source size. The true value is labeled with the red line.
Current usage metrics show cumulative count of Article Views (full-text article views including HTML views, PDF and ePub downloads, according to the available data) and Abstracts Views on Vision4Press platform.
Data correspond to usage on the plateform after 2015. The current usage metrics is available 48-96 hours after online publication and is updated daily on week days.
Initial download of the metrics may take a while.