Fig. 1.
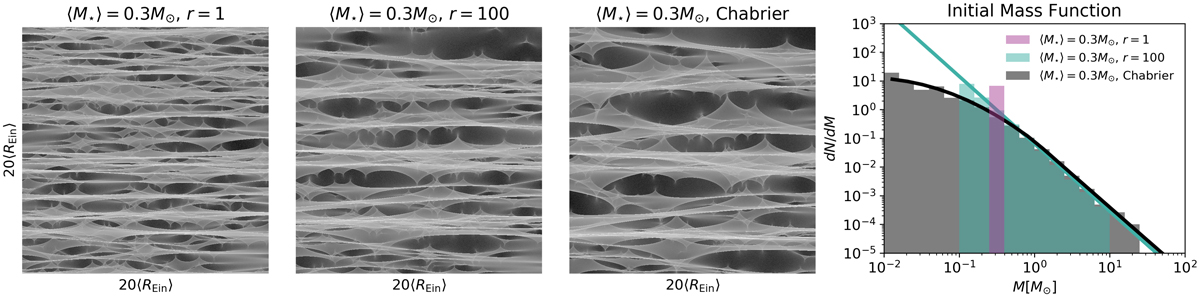
Examples of magnification maps for image A of RX J1131−1231 in the three left panels, with the corresponding IMFs in the right panel. All maps are 20⟨REin⟩ on a side, corresponding to 81922 pixels. The r factor corresponds to the ratio between the upper and lower bound of the mass interval, so that r = 1 indicates single-mass IMFs. The magnification probability distributions are shown in Fig. 2.
Current usage metrics show cumulative count of Article Views (full-text article views including HTML views, PDF and ePub downloads, according to the available data) and Abstracts Views on Vision4Press platform.
Data correspond to usage on the plateform after 2015. The current usage metrics is available 48-96 hours after online publication and is updated daily on week days.
Initial download of the metrics may take a while.