Fig. 4.
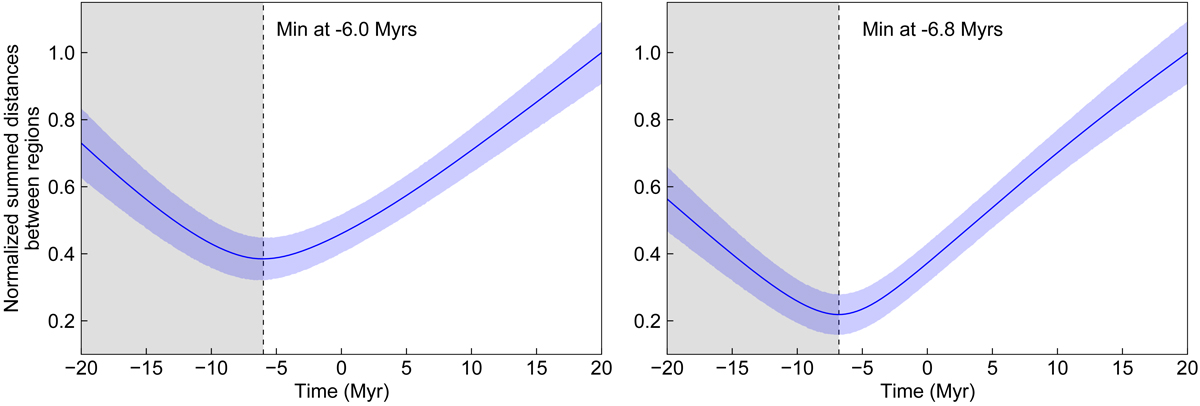
Estimated time when the subregions show the most compact configuration (minimum distances). Shown is the summed distance from each region to every other region at each time step (for ±20 Myr with 0.1 Myr timesteps), normalized to the maximum. The blue shaded area shows 1σ uncertainties, calculated by sampling the standard deviations around the averages. Left: the summed distances were calculated for all 14 investigated regions, which leads to a minimum at −6.0 Myr. Right: the summed distances were only calculated for nine regions by excluding the tail of Orion A. When excluding the tail the minimum gets more pronounced and shifts to −6.8 Myr. Beyond these minima the distances start to rise again (gray shaded areas), which means that any motions of the clouds before about −6 Myr should be omitted.
Current usage metrics show cumulative count of Article Views (full-text article views including HTML views, PDF and ePub downloads, according to the available data) and Abstracts Views on Vision4Press platform.
Data correspond to usage on the plateform after 2015. The current usage metrics is available 48-96 hours after online publication and is updated daily on week days.
Initial download of the metrics may take a while.