Fig. 6.
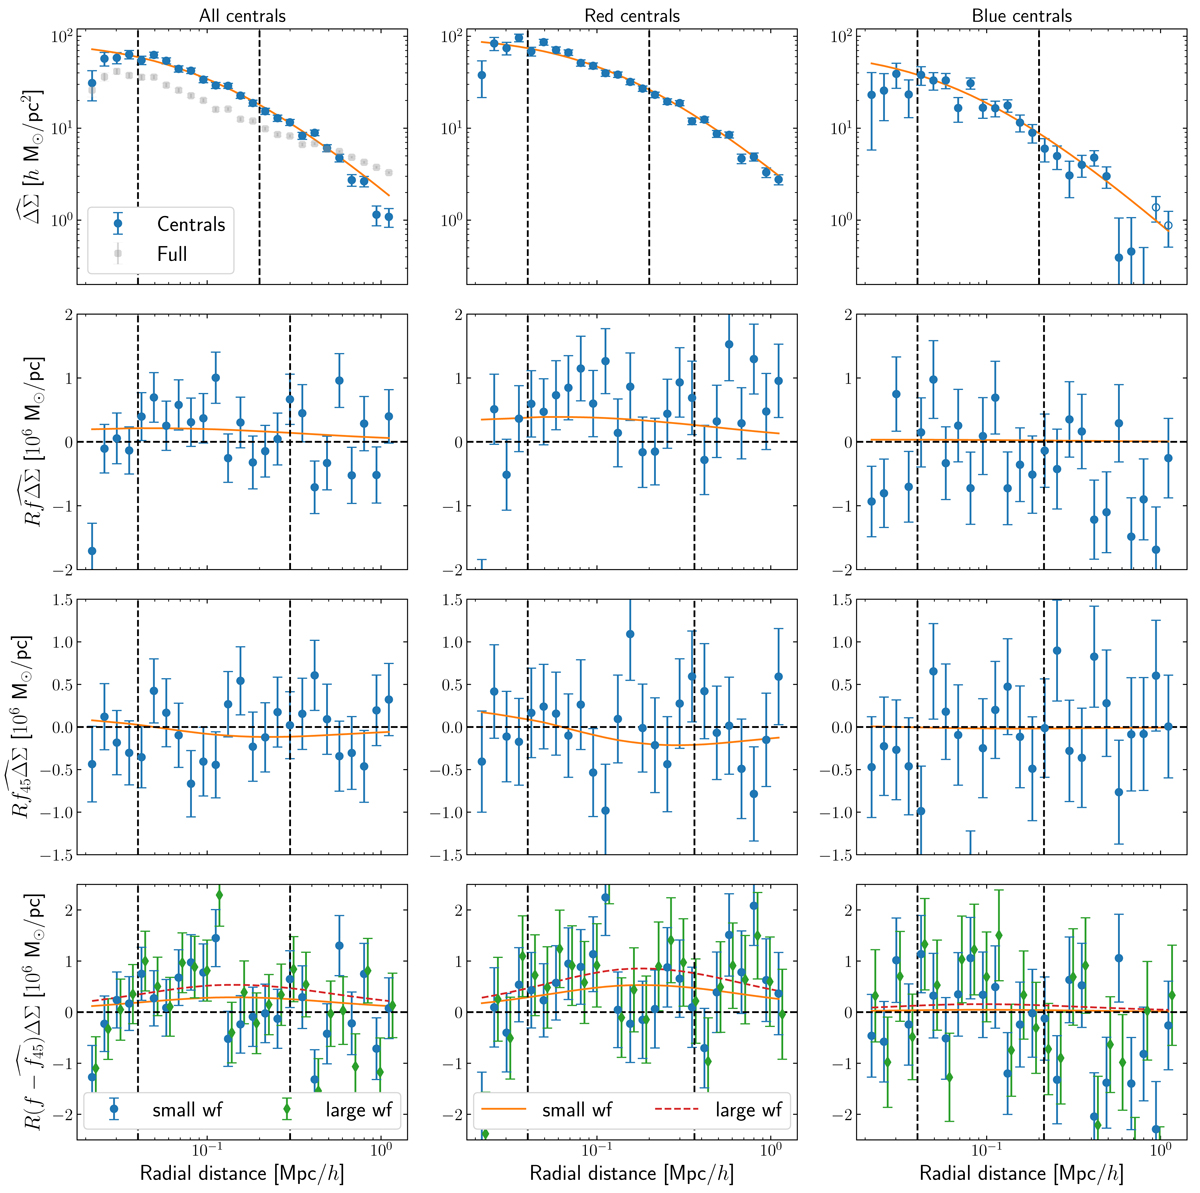
Measurements of the weak-lensing signal around our central galaxy sample. First column: results obtained for all centrals, and second and third columns: results for the red and blue sub-samples, respectively (with open circles placed for negative measurements). First row: isotropic lensing signal, second and third row: anisotropic lensing signal obtained with the estimators of Eqs. (11) and (12), and last row: difference, Eq. (13). The best-fit NFW profile is overplotted in the first row, with dashed vertical lines depicting the ranges that were used during the fit. We also show the isotropic lensing signal of the full KiDS-1000 sample as grey points as a comparison to the signal obtained using only the central galaxies. For the next rows we show the best-fit NFW profile multiplied by the best-fit fh and frel, frel, 45 and their difference, respectively, as well as the ranges we used during the fit with dashed lines. In the last row, we show with green diamonds and the dashed red line the data and model with the best-fit fh obtained using a larger weight function of rwf = 1.5 riso to measure the lens galaxy shapes.
Current usage metrics show cumulative count of Article Views (full-text article views including HTML views, PDF and ePub downloads, according to the available data) and Abstracts Views on Vision4Press platform.
Data correspond to usage on the plateform after 2015. The current usage metrics is available 48-96 hours after online publication and is updated daily on week days.
Initial download of the metrics may take a while.