Fig. 2.
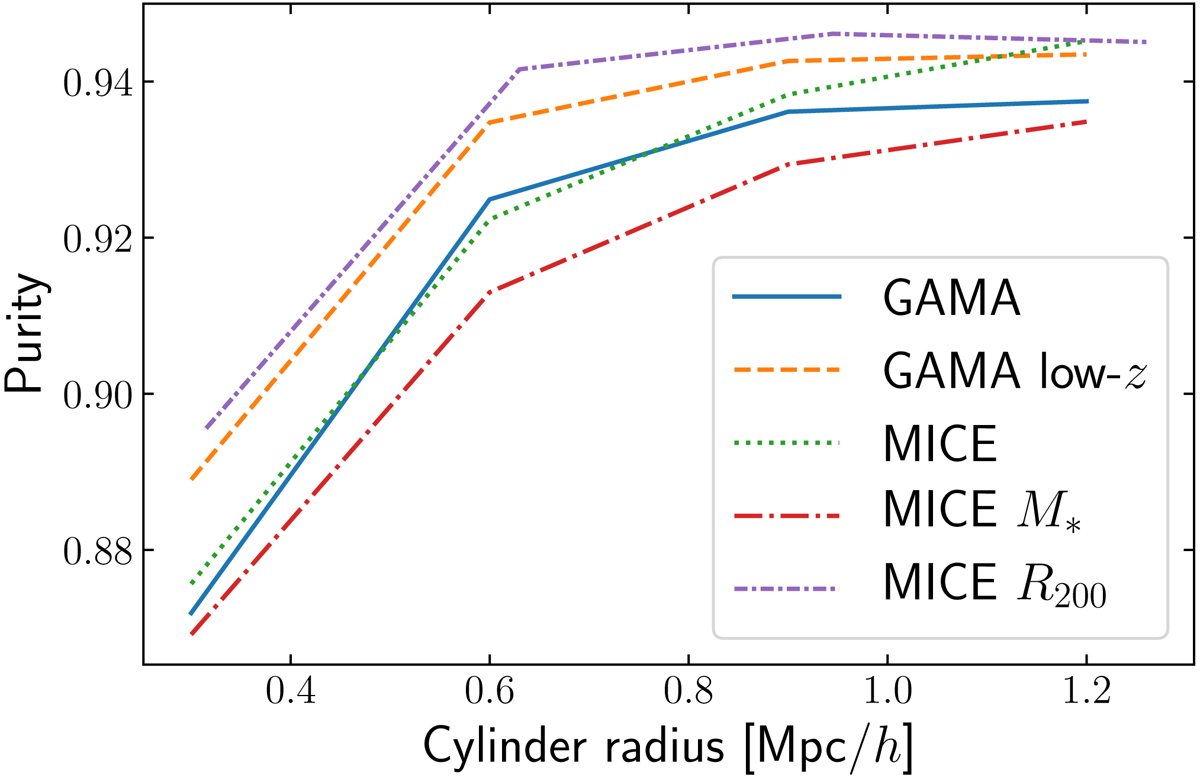
Purity of our central galaxy sample as a function of fixed cylinder radius used to identify centrals in overdense regions. Lines connect the individual points. In solid blue we show results from the GAMA+KiDS-1000 overlap in the photometric redshift space of 0.1 < z < 0.5. We also show the results for redshifts between 0.1 < z < 0.3 with a dashed orange line. The dotted green line shows the purity of the sample obtained using the MICE2 mock catalogues for 0.1 < z < 0.5. The dash-dotted red line shows results obtained when we searched for the most massive (in terms of stellar mass) galaxy in the cylinder centre instead of the brightest one. Finally, the dense dash-dotted purple line represents results obtained when instead of a fixed cylinder radius we used multiples k of the galaxy R200 to define the radius size, with k = {1, 2, 3, 4}. In this case, we plot the median value of the cylinder radius on the x-axis, corresponding to the four different purity values.
Current usage metrics show cumulative count of Article Views (full-text article views including HTML views, PDF and ePub downloads, according to the available data) and Abstracts Views on Vision4Press platform.
Data correspond to usage on the plateform after 2015. The current usage metrics is available 48-96 hours after online publication and is updated daily on week days.
Initial download of the metrics may take a while.