Fig. 1.
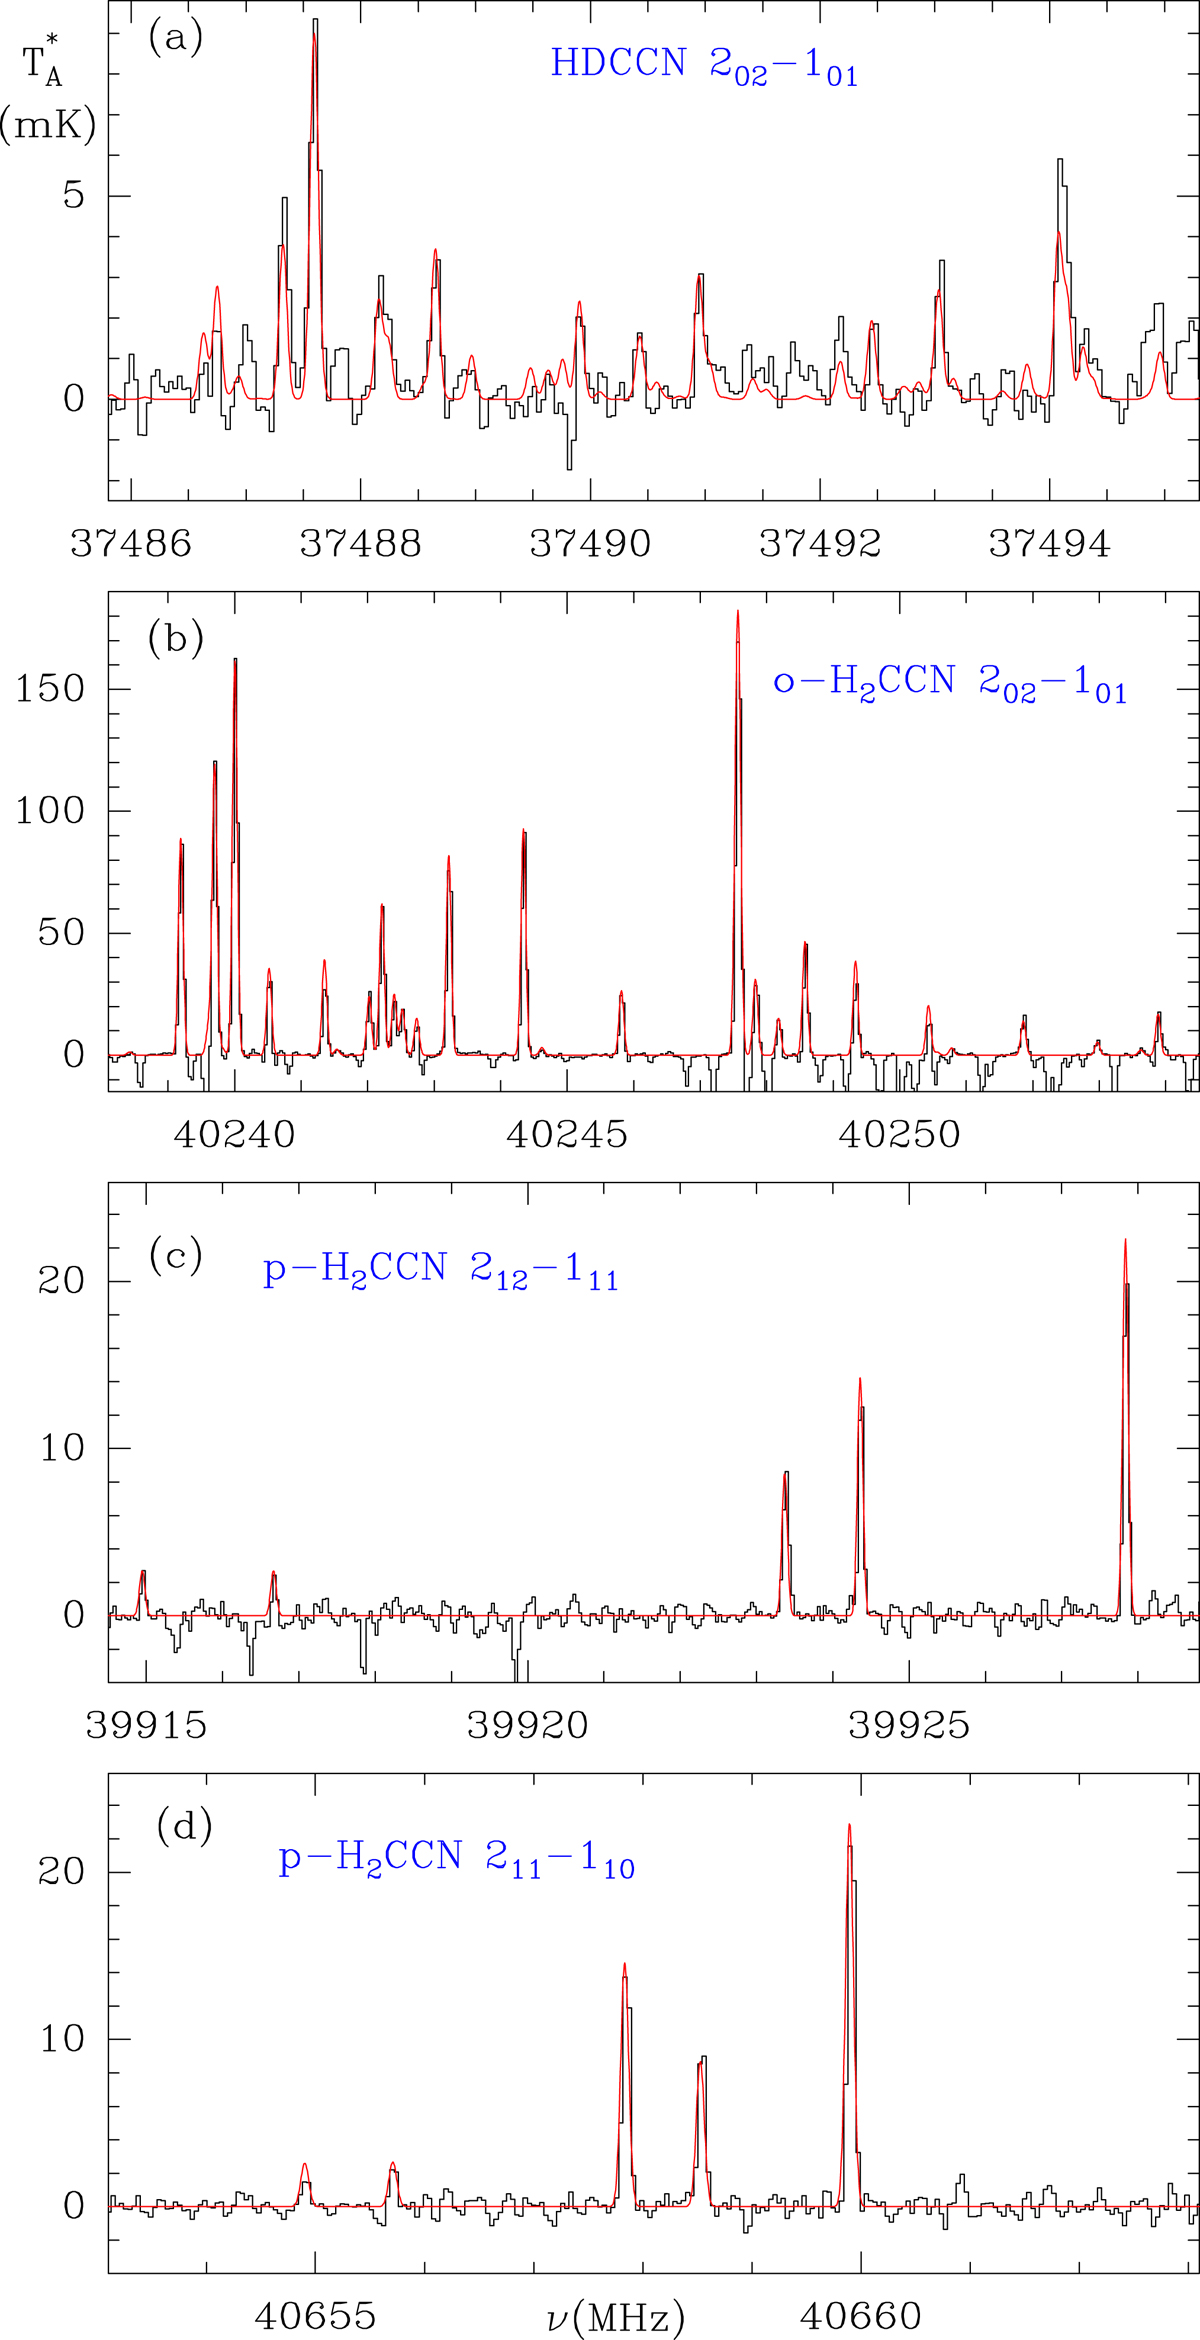
(a) Observed group of lines assigned to the hyperfine structure of the 20, 2–10, 1 transition of HDCCN (black histogram). (b) The observed hyperfine structure of the same transition of o-H2CCN. (c) Selected hyperfine components of the 212–111 transition of p-H2CCN. (d) Selected hyperfine components of the 211–110 transition of p-H2CCN. In all panels, the abscissa represents the rest frequency (in MHz) assuming a local standard of rest velocity for the source of 5.83 km s−1 (Cernicharo et al. 2020c). The ordinate is the antenna temperature in mK. The red curve in each panel represents the best model fit to the emission of this species in TMC-1 for a rotational temperature of 10 K. A similar fit is obtained for other rotational temperatures (see Sect. 4.1 and Table 2). Negative features are due to the folding of the frequency-switching data.
Current usage metrics show cumulative count of Article Views (full-text article views including HTML views, PDF and ePub downloads, according to the available data) and Abstracts Views on Vision4Press platform.
Data correspond to usage on the plateform after 2015. The current usage metrics is available 48-96 hours after online publication and is updated daily on week days.
Initial download of the metrics may take a while.