Fig. 3.
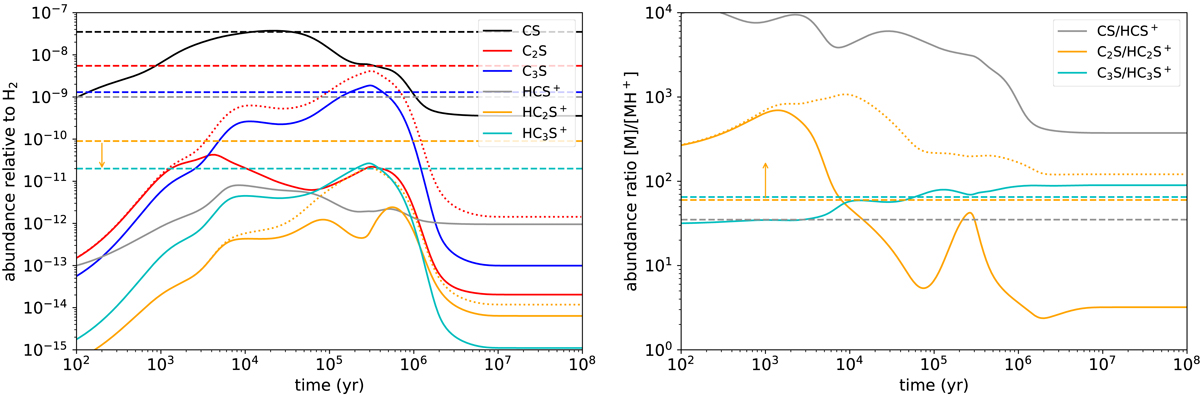
Calculated abundances (left) and abundance ratios (right) as a function of time for a cold dense cloud. Observed values in TMC-1 (see Table 3) are indicated by horizontal dashed lines. The observed HC2S+ abundance and C2S/HC2S+ ratio are an upper and a lower limit, respectively, and are indicated by vertical arrows. Dotted lines represent the calculated abundances of C2S and HC2S+ (left panel) and its ratio (right panel) when the reaction O + C2S is neglected.
Current usage metrics show cumulative count of Article Views (full-text article views including HTML views, PDF and ePub downloads, according to the available data) and Abstracts Views on Vision4Press platform.
Data correspond to usage on the plateform after 2015. The current usage metrics is available 48-96 hours after online publication and is updated daily on week days.
Initial download of the metrics may take a while.