Fig. 2.
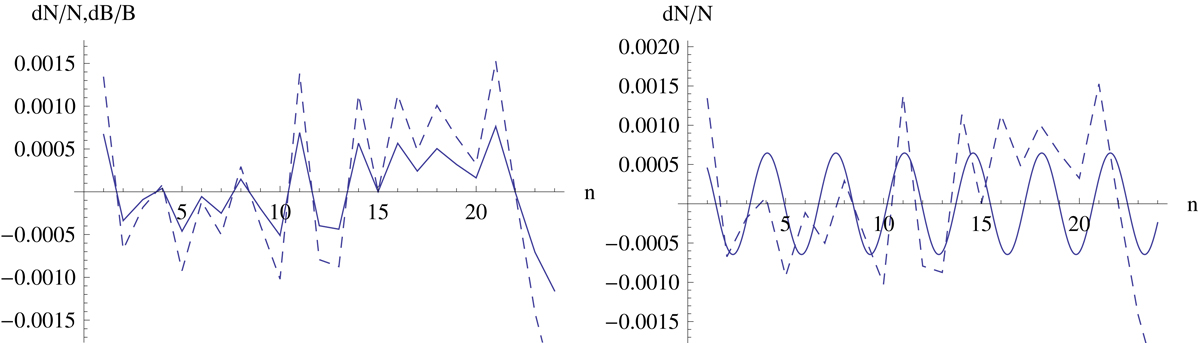
Variations computed for the 21 June 2011 zebra at 03:22:27.4 UT. Left: relative variations in magnetic field dB/B (solid line) and plasma density dN/N (dashed line) depending on n. Right: relative plasma density variations (dashed line) depending on n in comparison with a cosine function (solid line) with amplitude A = 0.00064 and wavelength Lchar = 3.50.
Current usage metrics show cumulative count of Article Views (full-text article views including HTML views, PDF and ePub downloads, according to the available data) and Abstracts Views on Vision4Press platform.
Data correspond to usage on the plateform after 2015. The current usage metrics is available 48-96 hours after online publication and is updated daily on week days.
Initial download of the metrics may take a while.