Free Access
Fig. 1.
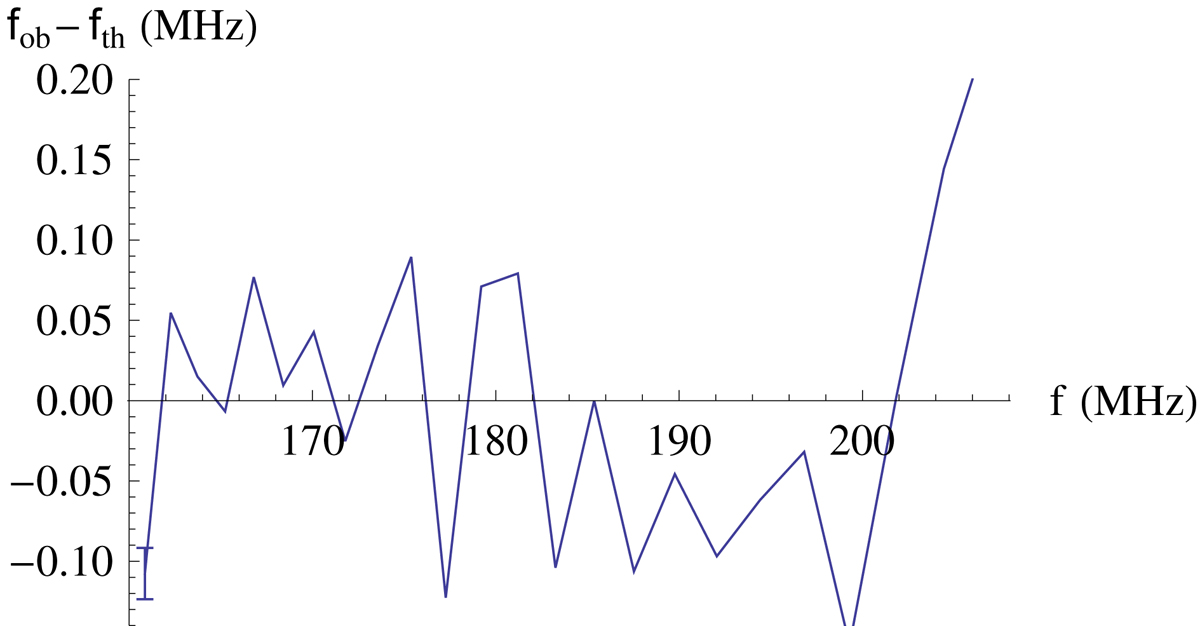
Difference between the zebra-stripe frequencies fob observed at 03:22:27.4 UT and those fth calculated according to Eq. (3) in dependence on the zebra-stripe frequency. At the lowest frequency, the error bar is shown, calculated from the accuracy in determining the observed zebra-stripe frequencies.
Current usage metrics show cumulative count of Article Views (full-text article views including HTML views, PDF and ePub downloads, according to the available data) and Abstracts Views on Vision4Press platform.
Data correspond to usage on the plateform after 2015. The current usage metrics is available 48-96 hours after online publication and is updated daily on week days.
Initial download of the metrics may take a while.