Free Access
Fig. 2.
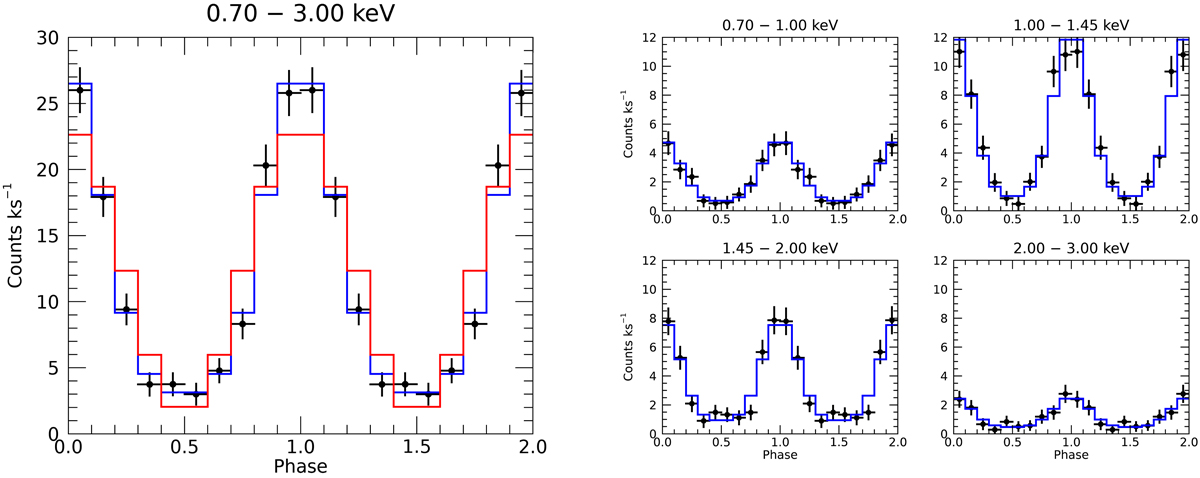
Phase-folded light curves of PSR J2021+4026 as observed by EPIC-pn in the range of 0.7 − 3 keV (left panel) and 0.7 − 1 − 1.45 − 2 − 3 keV (right panel). The data (black dots) were obtained with the 2D-ML in ten phase bins. The red (sine, Eq. (4)) and blue (Gaussian, Eq. (5)) lines were obtained with the 3D-ML.
Current usage metrics show cumulative count of Article Views (full-text article views including HTML views, PDF and ePub downloads, according to the available data) and Abstracts Views on Vision4Press platform.
Data correspond to usage on the plateform after 2015. The current usage metrics is available 48-96 hours after online publication and is updated daily on week days.
Initial download of the metrics may take a while.