Fig. 15.
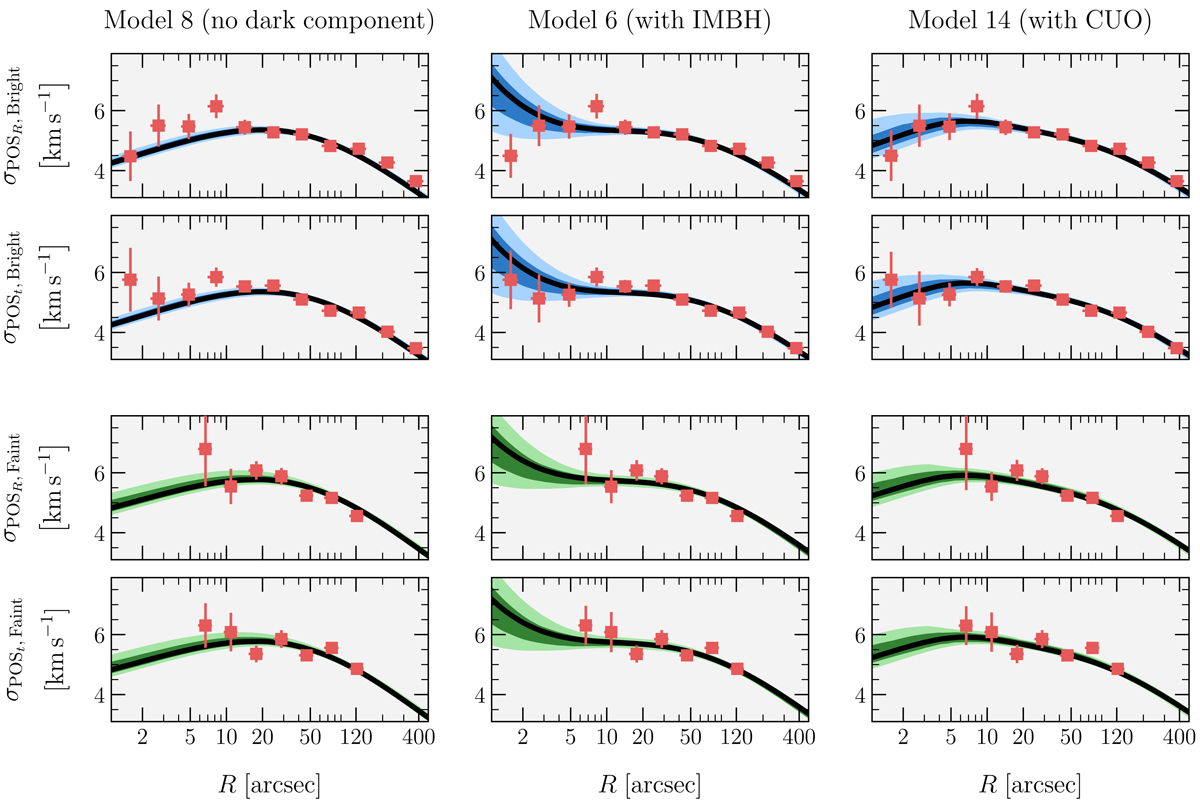
Goodness of fit plots of plane of sky (POS) velocity dispersions as a function of the projected radius for models 8 (no dark component, left), 6 (IMBH, middle) and 14 (central unresolved objects, right), which all consider two stellar populations, one of brighter (blue) stars and another of fainter (green) ones. The black curves display the maximum likelihood solutions, while the darker and lighter shaded regions show the [16, 84] and [2.5, 97.5] percentiles, respectively. The red squares show the data in logarithmic spaced bins. The vertical error bars were calculated using a bootstrap method, while the horizontal error bars considered the radial quantization noise.
Current usage metrics show cumulative count of Article Views (full-text article views including HTML views, PDF and ePub downloads, according to the available data) and Abstracts Views on Vision4Press platform.
Data correspond to usage on the plateform after 2015. The current usage metrics is available 48-96 hours after online publication and is updated daily on week days.
Initial download of the metrics may take a while.