Free Access
Fig. 2
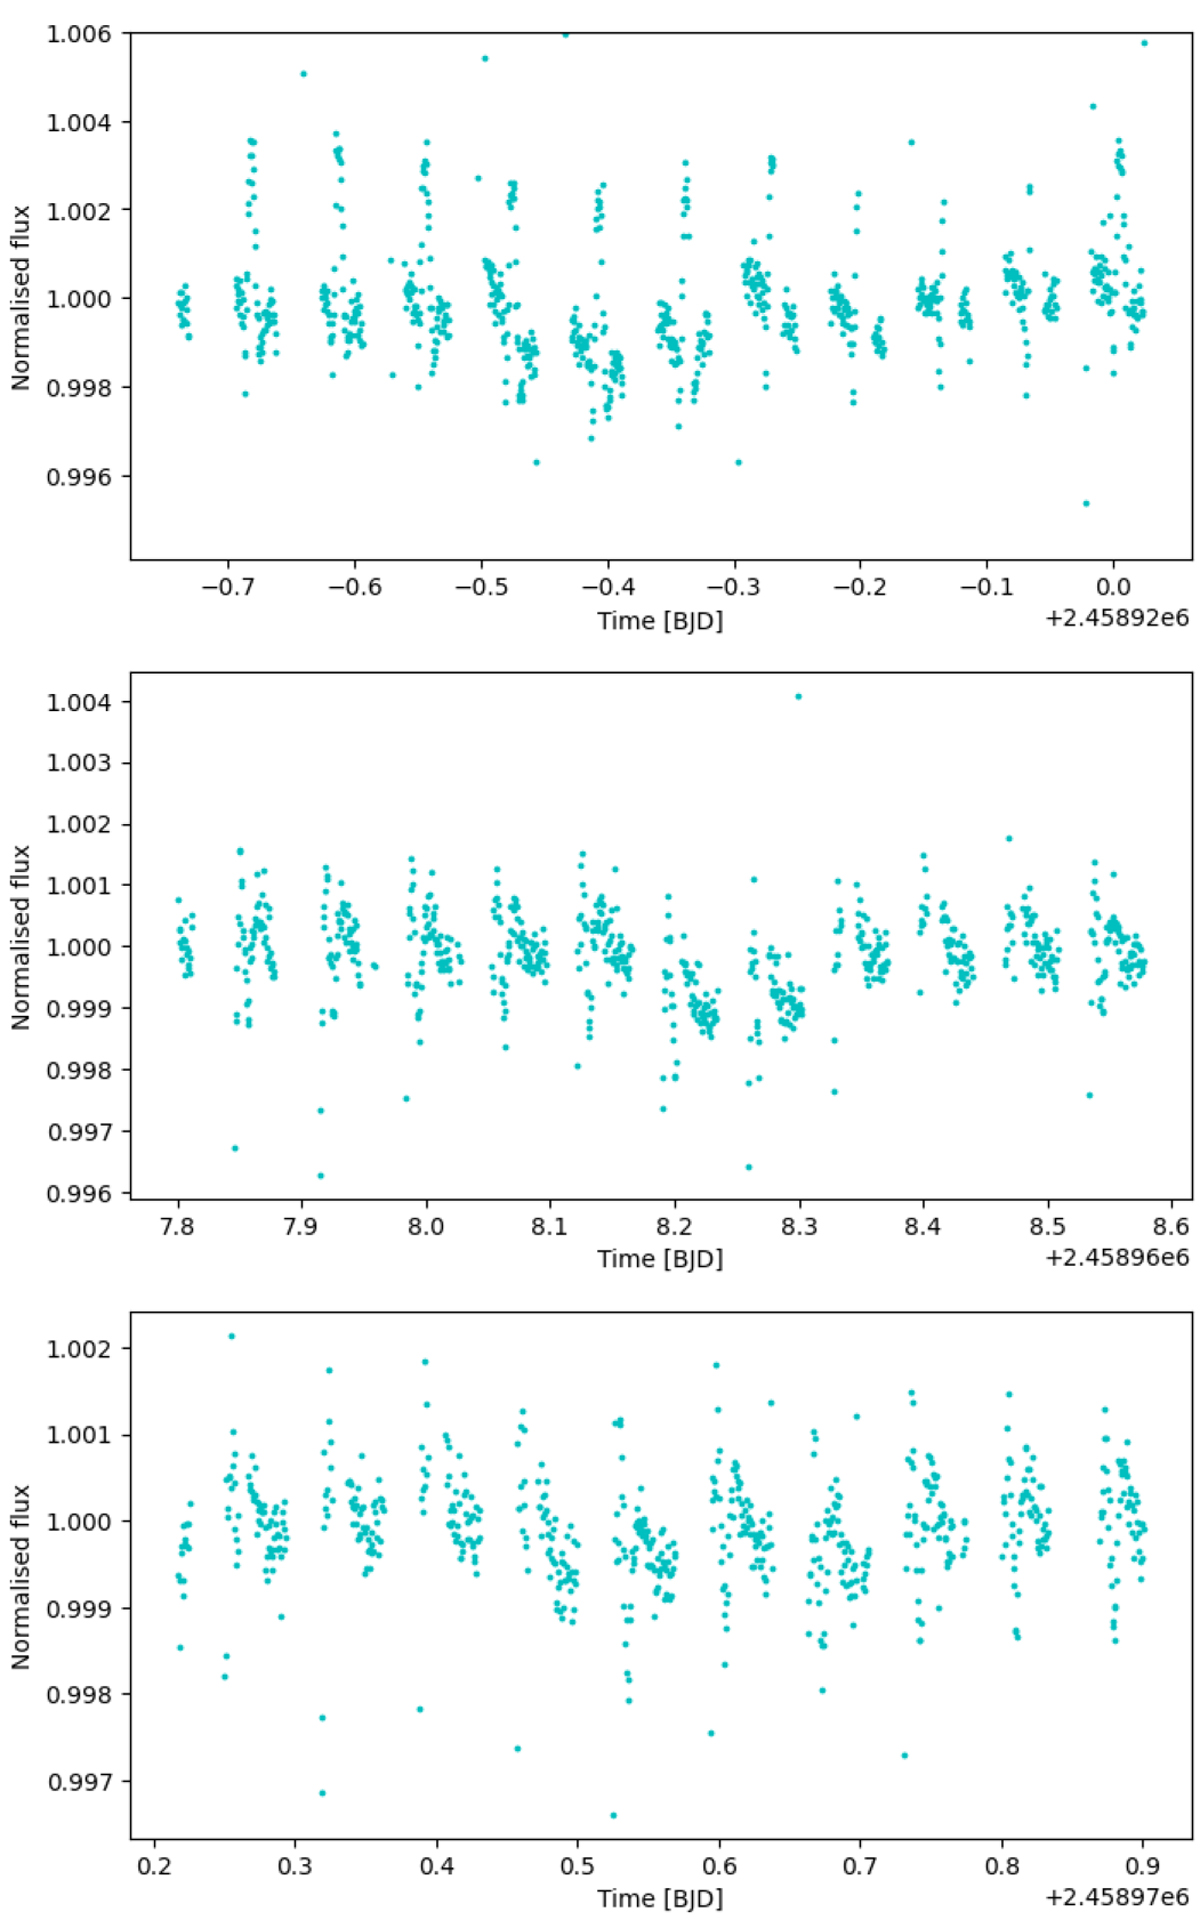
Raw LCs of the three CHEOPS visits analysed here, as processed by the Data Reduction Pipeline v12. The datasets are presented from top to bottom in chronological order of observation. The periodical light variations, especially visible in the first visit, correlate with the roll angle (see the text for further details).
Current usage metrics show cumulative count of Article Views (full-text article views including HTML views, PDF and ePub downloads, according to the available data) and Abstracts Views on Vision4Press platform.
Data correspond to usage on the plateform after 2015. The current usage metrics is available 48-96 hours after online publication and is updated daily on week days.
Initial download of the metrics may take a while.