Fig. 14
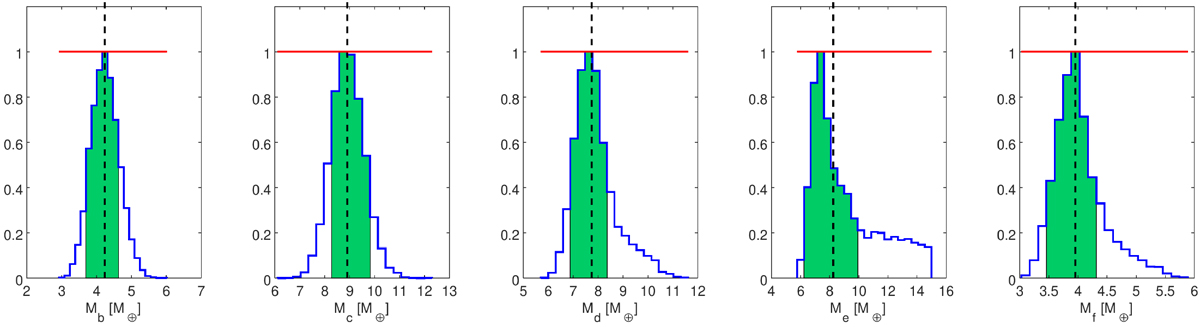
Posterior distributions for the masses Mp of the planets composing the HD 108236 system. In each panel, the horizontal red line represents the flat prior imposed on Mp, implying that Mp was set as a free parameter. The dashed black line marks the median of the distribution, while the green area shows the 68% highestposterior density credible interval.
Current usage metrics show cumulative count of Article Views (full-text article views including HTML views, PDF and ePub downloads, according to the available data) and Abstracts Views on Vision4Press platform.
Data correspond to usage on the plateform after 2015. The current usage metrics is available 48-96 hours after online publication and is updated daily on week days.
Initial download of the metrics may take a while.