Fig. 10
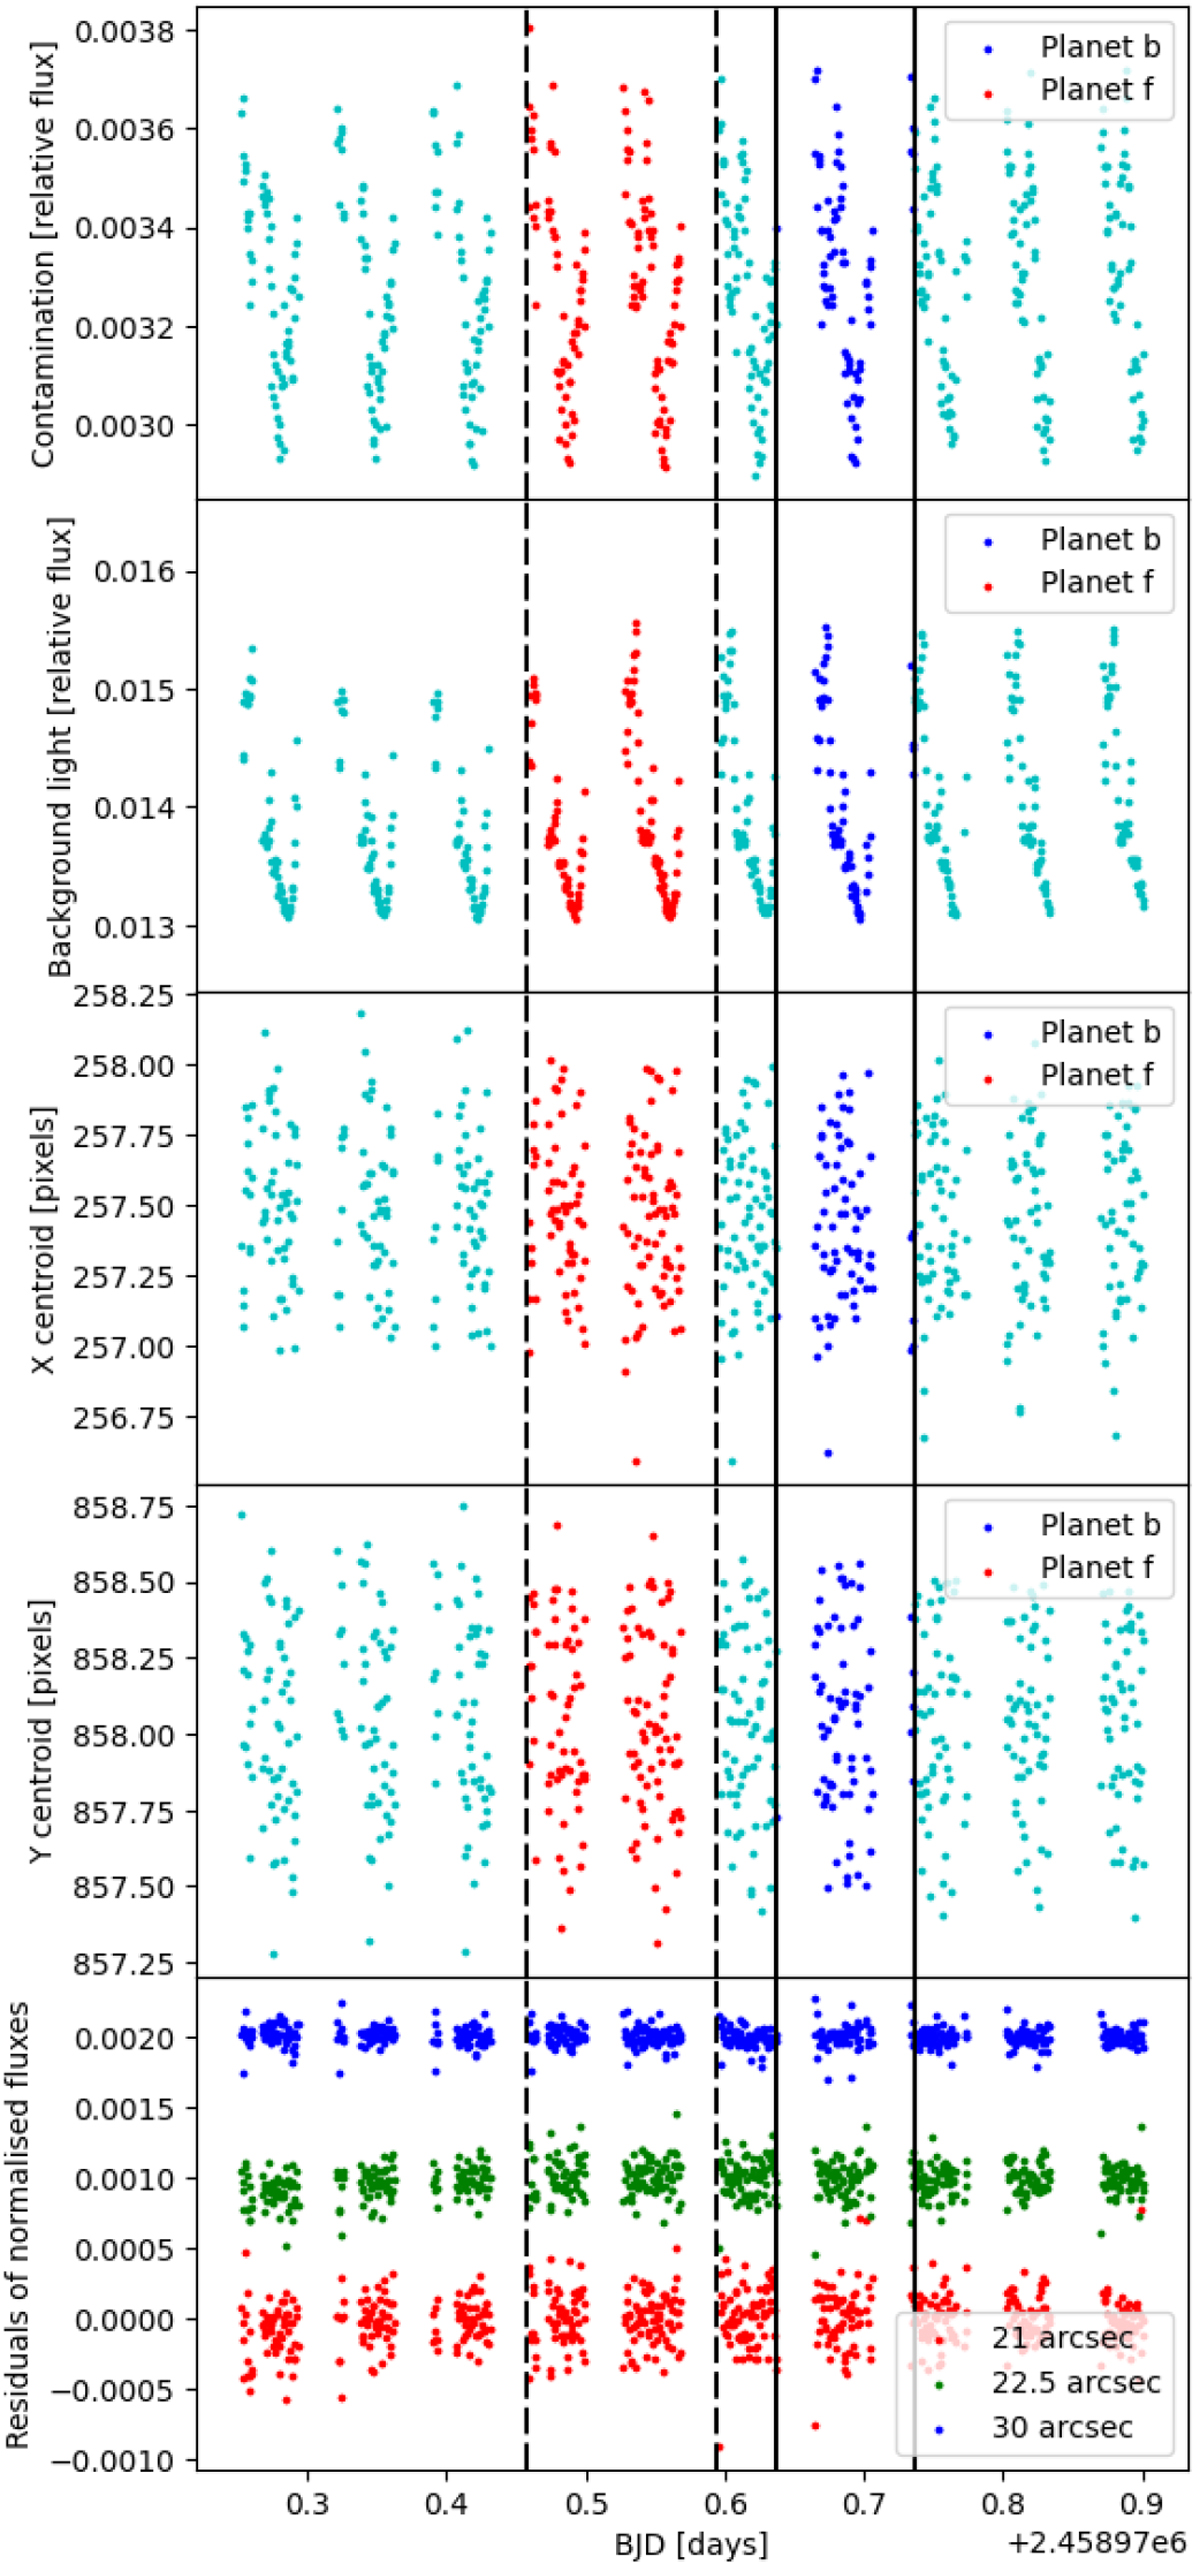
All the represented quantities expressed as a function of time during the third CHEOPS visit (i.e. the one containing the transits of HD 108236 b and HD 108236 f). Top two panels: flux of contaminating stars entering the photometricaperture and background light (both relative to the flux of HD 108236). Third and fourth panels from top: x- and y-coordinate of the PSF centroid. The transit windows of planets b and f are highlighted in blue and red, respectively, while the out-of-transit points are in cyan. Bottom panel: residuals of the normalised fluxes (shifted vertically for visualisation purposes) obtained after subtracting the reference normalised flux computed considering the DEFAULT aperture to the normalised fluxes computed considering the other three available apertures. No correlation is present between flux and aperture size. Transit windows of planets b and f are marked by solid and dashed vertical lines, respectively.
Current usage metrics show cumulative count of Article Views (full-text article views including HTML views, PDF and ePub downloads, according to the available data) and Abstracts Views on Vision4Press platform.
Data correspond to usage on the plateform after 2015. The current usage metrics is available 48-96 hours after online publication and is updated daily on week days.
Initial download of the metrics may take a while.