Fig. 5.
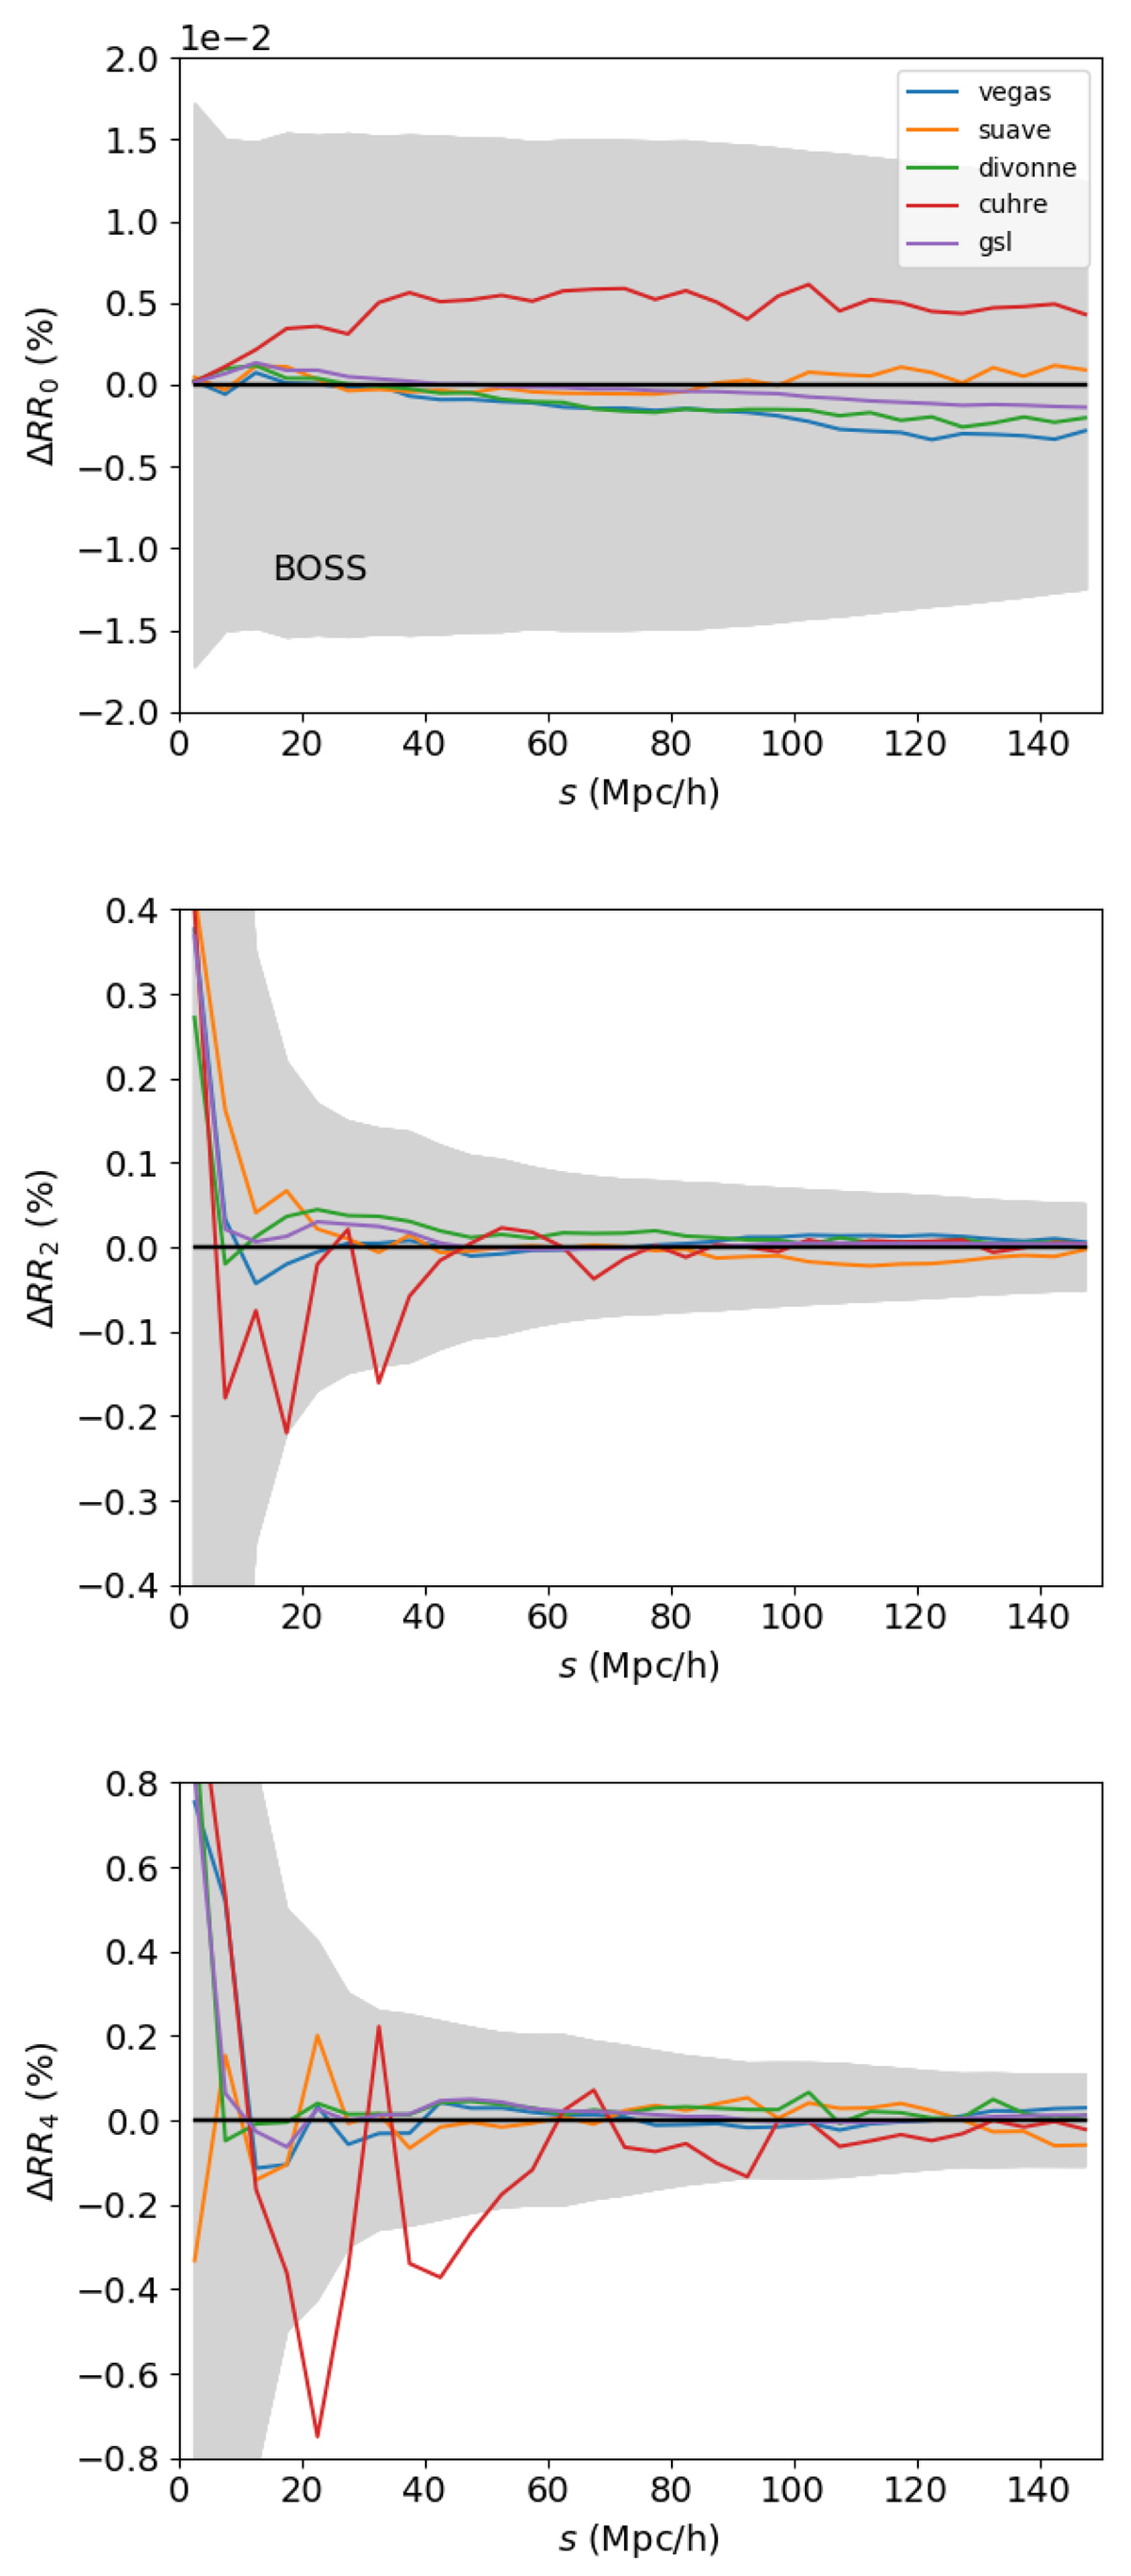
Relative difference between the analytical and random catalogue-based mean ⟨RR⟩ pair-count multipole moments (ℓ = 0, 2, 4, in the top, middle, and bottom panels, respectively) for BOSS. The grey shaded area shows the standard deviation among the random catalogues, while blue, orange, green, red, and purple curves present the relative differences obtained with vegas, suave, divonne, cuhre, and gsl algorithms, respectively, when using ε = 10−5.
Current usage metrics show cumulative count of Article Views (full-text article views including HTML views, PDF and ePub downloads, according to the available data) and Abstracts Views on Vision4Press platform.
Data correspond to usage on the plateform after 2015. The current usage metrics is available 48-96 hours after online publication and is updated daily on week days.
Initial download of the metrics may take a while.