Fig. 8.
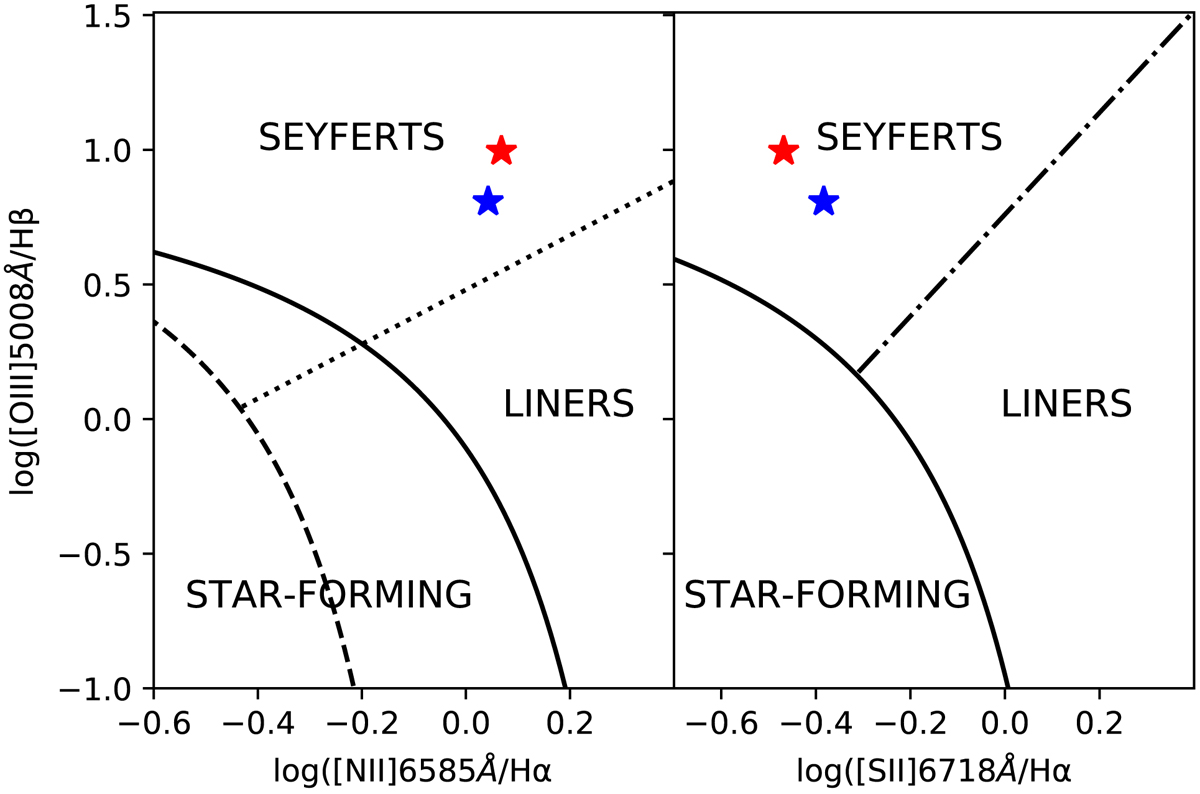
BPT diagram of the blue (blue star symbol) and red (red star symbol) components detected in the optical spectrum of SDSS J1431+4358. The solid and dashed lines divide the regions mainly populated by star-forming galaxies and AGN from Kewley et al. (2001, 2006) and Kauffmann et al. (2003), respectively. The dotted and dot-dashed lines demarcate the Seyfert and LINER zones from Cid Fernandes et al. (2010) and Kewley et al. (2006), respectively.
Current usage metrics show cumulative count of Article Views (full-text article views including HTML views, PDF and ePub downloads, according to the available data) and Abstracts Views on Vision4Press platform.
Data correspond to usage on the plateform after 2015. The current usage metrics is available 48-96 hours after online publication and is updated daily on week days.
Initial download of the metrics may take a while.