Fig. 7.
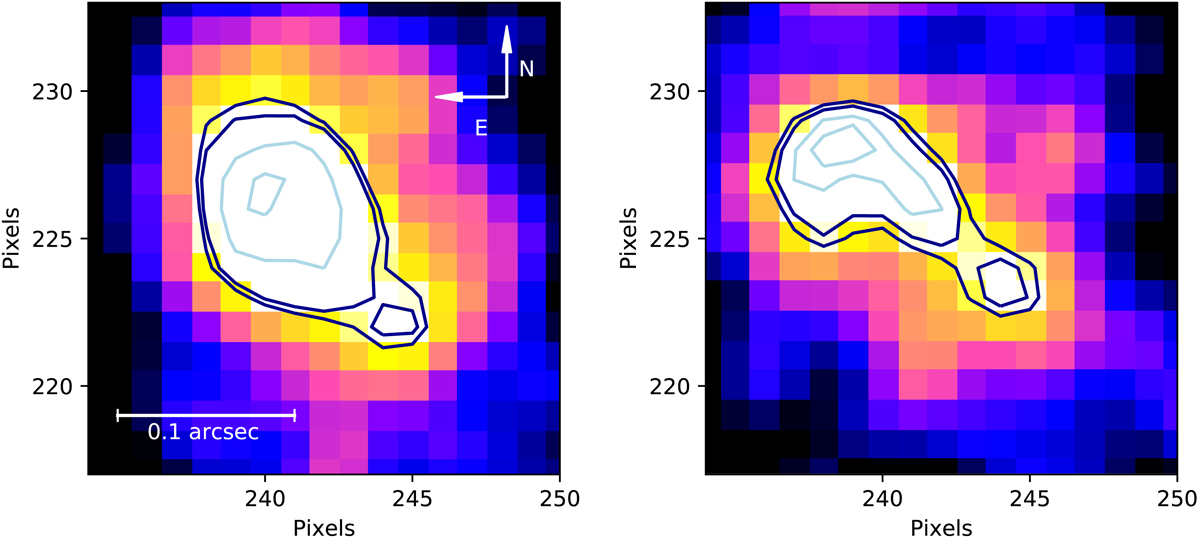
Left panel: K-band residual image (0.24″ × 0.24″) centered on SDSS J1431+4358. The image was obtained by smoothing the real K-band residual image with a Gaussian filter (σ = 1 pixel = 0.015″; see Sect. 3.2). Contour plots are overlaid: the dark blue (light blue) lines indicate the pixels with a value of 2.5 and 2.7 (3 and 4) times the standard deviation of the background of the unsmoothed residual image. Right panel: simulated image, obtained by considering two point-like sources (relative distance of 0.12″ and with K-magnitudes equal to 19.5 mag and 20.3 mag), the true PSF image, and the background sky (see Sect. 3.2 for details). The image was obtained by smoothing the simulated image with a Gaussian filter (σ = 1 pixel = 0.015″). Contour plots are overlaid: The dark blue (light blue) lines indicate the pixels with a value of 2.5 and 2.7 (3 and 4) times the standard deviation of the background of the unsmoothed simulated image.
Current usage metrics show cumulative count of Article Views (full-text article views including HTML views, PDF and ePub downloads, according to the available data) and Abstracts Views on Vision4Press platform.
Data correspond to usage on the plateform after 2015. The current usage metrics is available 48-96 hours after online publication and is updated daily on week days.
Initial download of the metrics may take a while.