Fig. 3.
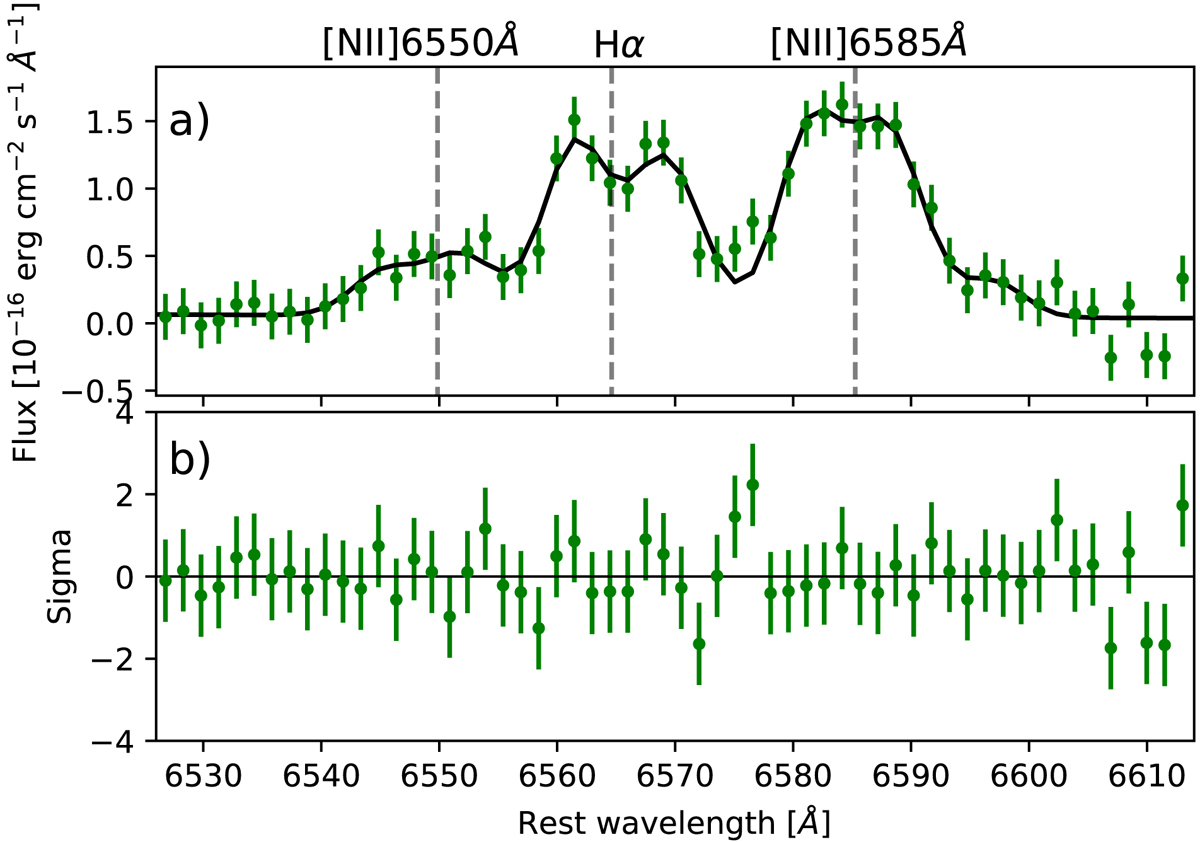
Residual spectrum of SDSS J1431+4358 (green symbols in this figure and in Fig. 1) around the Hα + [NII]λ6550 Å, λ6585 Å emission line region. The spectrum is shown in the rest-frame vacuum wavelengths. The gray dashed vertical lines mark the position of the emission line at the systemic velocity of the host galaxy. Panel a: the black solid line is the model obtained by the combination of a power-law continuum plus two Gaussian emission line components for both the Hα and for each of the [NII] emission lines. Panel b: relevant residuals, shown in terms of sigmas.
Current usage metrics show cumulative count of Article Views (full-text article views including HTML views, PDF and ePub downloads, according to the available data) and Abstracts Views on Vision4Press platform.
Data correspond to usage on the plateform after 2015. The current usage metrics is available 48-96 hours after online publication and is updated daily on week days.
Initial download of the metrics may take a while.