Fig. 1.
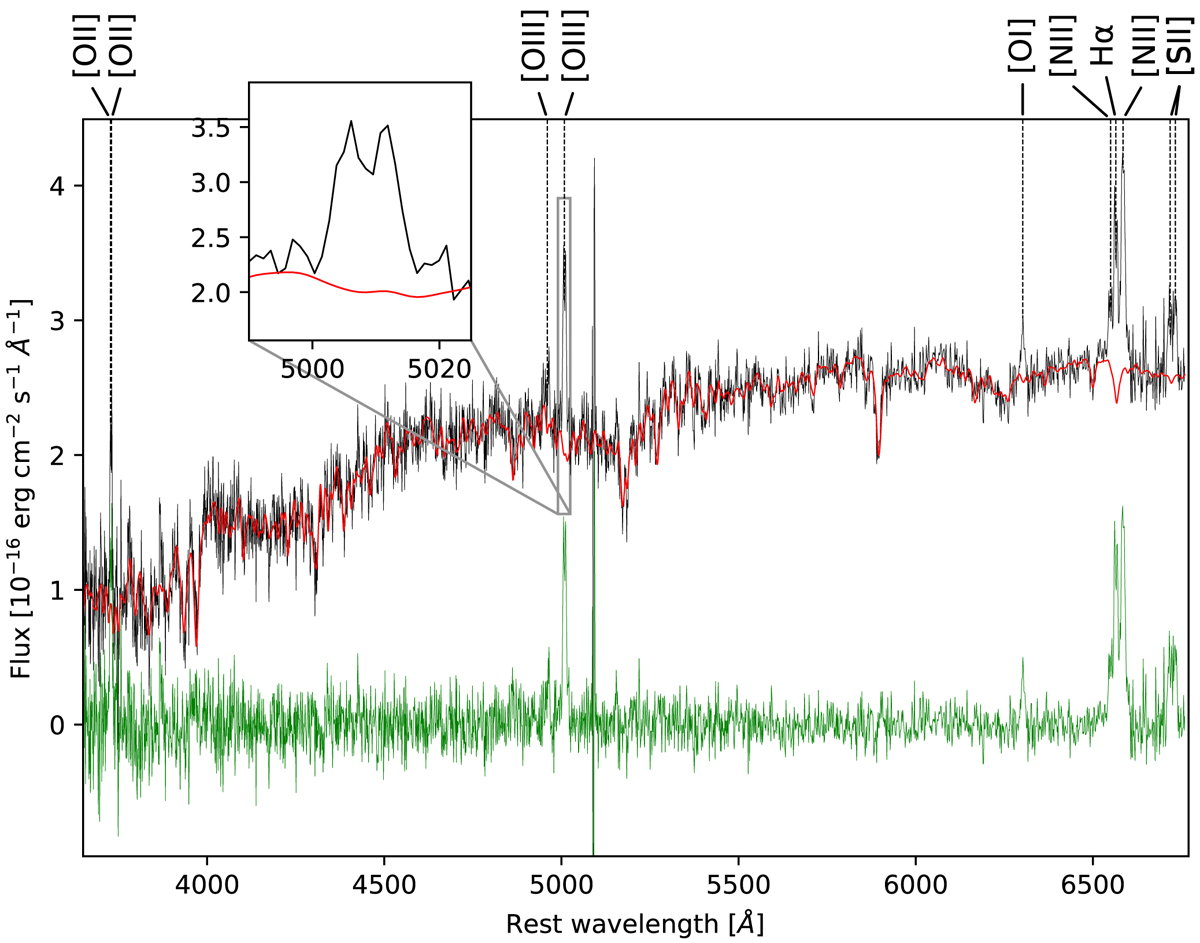
SDSS J143132.84+435807.20 rest-frame SDSS-DR15 spectrum (black line). The strongest emission lines are labeled and an inset of the spectrum covering the [OIII]λ5008 Å (rest–frame vacuum wavelengths) emission line is shown. The red curve indicates the best-fitting MILES model resulting from the pPXF spectral fitting (see Sect. 3.1), while the green spectrum indicates the residual obtained after the subtraction of the stellar component from the observed spectrum.
Current usage metrics show cumulative count of Article Views (full-text article views including HTML views, PDF and ePub downloads, according to the available data) and Abstracts Views on Vision4Press platform.
Data correspond to usage on the plateform after 2015. The current usage metrics is available 48-96 hours after online publication and is updated daily on week days.
Initial download of the metrics may take a while.