Free Access
Fig. 8.
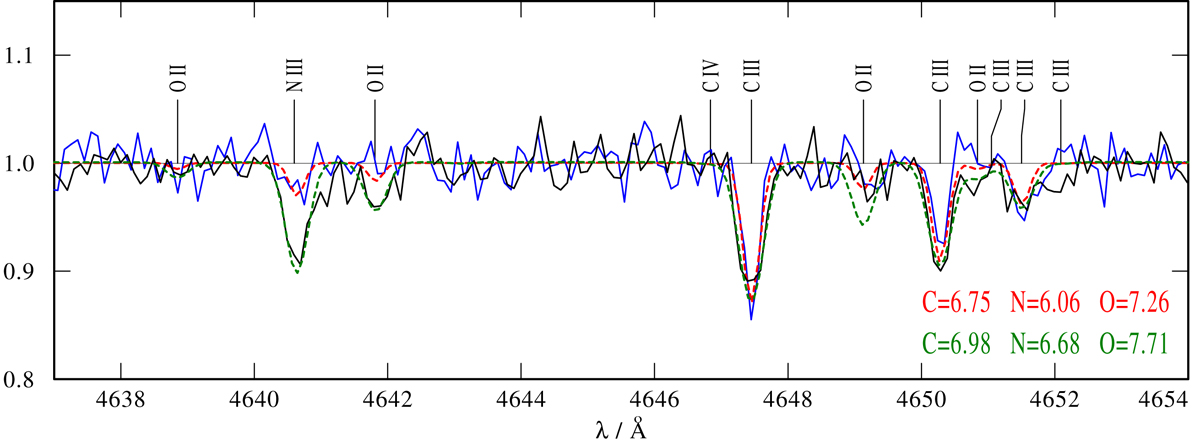
Comparison of C III, N III, and O II lines in the MBO2 (solid blue) and MBO3 (solid black) spectra. The carbon, nitrogen and oxygen abundances in the overplotted best-fitting model of MBO2 (dotted red) are lower compared to those of MBO3 (dotted green) by a factor of two, four, and three, respectively.
Current usage metrics show cumulative count of Article Views (full-text article views including HTML views, PDF and ePub downloads, according to the available data) and Abstracts Views on Vision4Press platform.
Data correspond to usage on the plateform after 2015. The current usage metrics is available 48-96 hours after online publication and is updated daily on week days.
Initial download of the metrics may take a while.