Fig. 14.
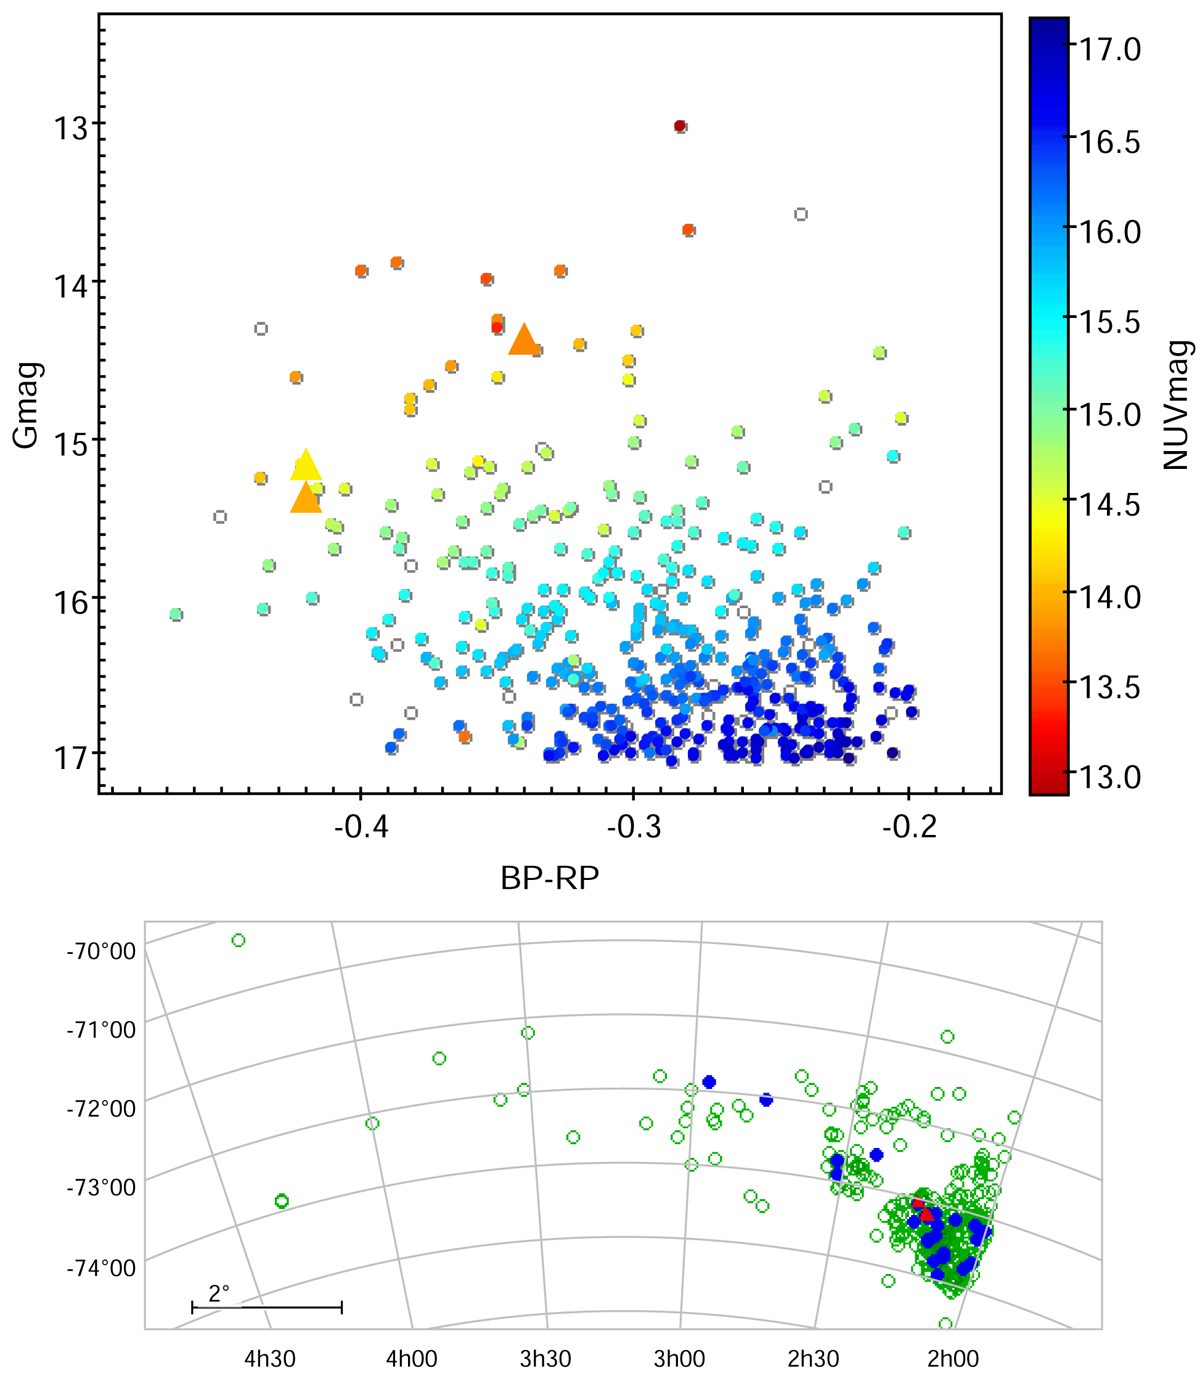
Magellanic Bridge massive star population from the Gaia DR2-Galex GR6/7 data. Upper panel: Gaia color-magnitude diagram of Bridge stars, which are color coded to their corresponding NUV magnitudes. Our sample O stars are plotted by triangles. Lower panel: location of OB stars in the Magellanic Bridge (green open circles). Blue filled circles represent the location of stars with NUV < 14.5, which are candidate O stars. Red triangle shows the location of our analyzed O stars.
Current usage metrics show cumulative count of Article Views (full-text article views including HTML views, PDF and ePub downloads, according to the available data) and Abstracts Views on Vision4Press platform.
Data correspond to usage on the plateform after 2015. The current usage metrics is available 48-96 hours after online publication and is updated daily on week days.
Initial download of the metrics may take a while.