Fig. 7.
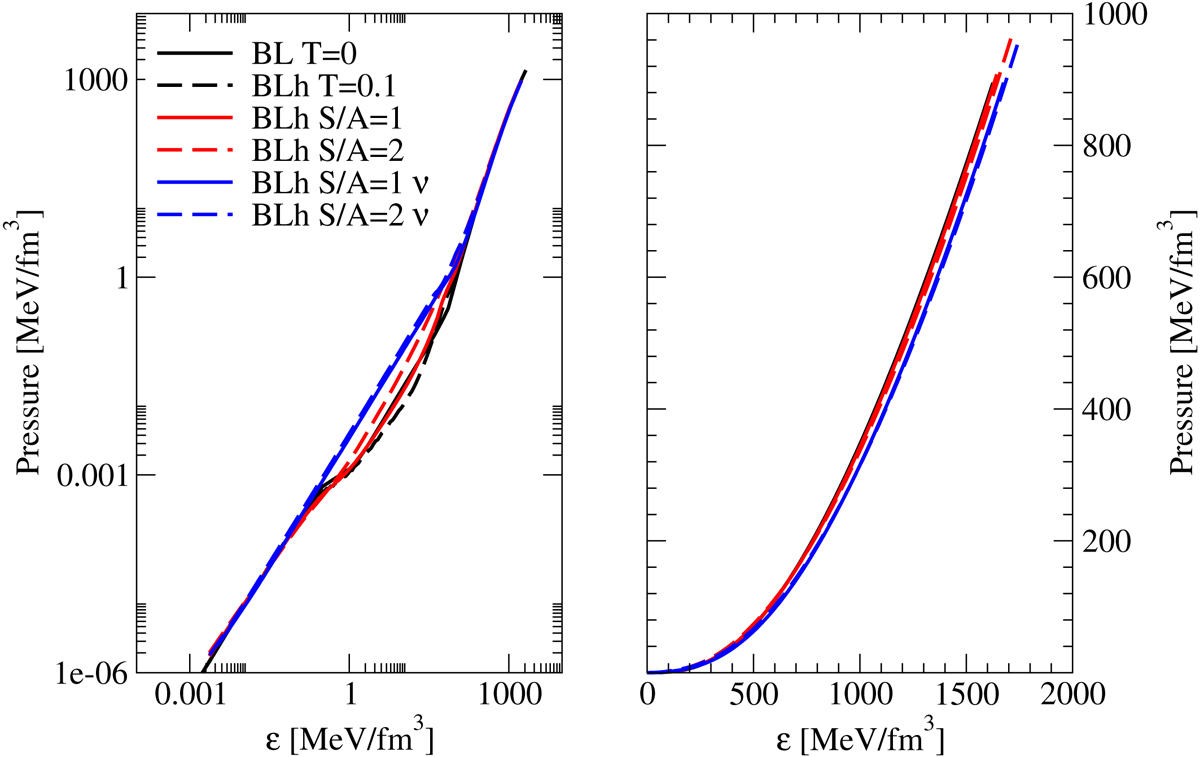
Pressure vs. energy density (ε) relations for various β-stable EOSs derived in different thermodynamical stellar conditions. Left (right) panel: we use a logarithmic (linear) scale. The BL T = 0 (black continuous line) taken from Bombaci & Logoteta (2018) is shown for reference. We note that for the BL EOS for nuclear densities below 0.08 fm−3, the Sly4 EOS (Haensel & Pichon 1994; Douchin & Haensel 2001) has been adopted (Endrizzi et al. 2018). The BLh with T = 0.1 MeV is represented by the black dashed line. Red and blue curves refer to the following cases: isoentropic EOS with S/A = 1 and S/A = 2 without neutrino trapping (red dashed lines) and isoentropic EOS with S/A = 1 and S/A = 2 with neutrino trapping (blue continuous and dashed lines). For the low-density part of the BLh EOSs, we employ the TM1 model (Sugahara & Toki 1994). Temperatures (T) in the figure are in MeV. (See text for further details).
Current usage metrics show cumulative count of Article Views (full-text article views including HTML views, PDF and ePub downloads, according to the available data) and Abstracts Views on Vision4Press platform.
Data correspond to usage on the plateform after 2015. The current usage metrics is available 48-96 hours after online publication and is updated daily on week days.
Initial download of the metrics may take a while.