Fig. 3.
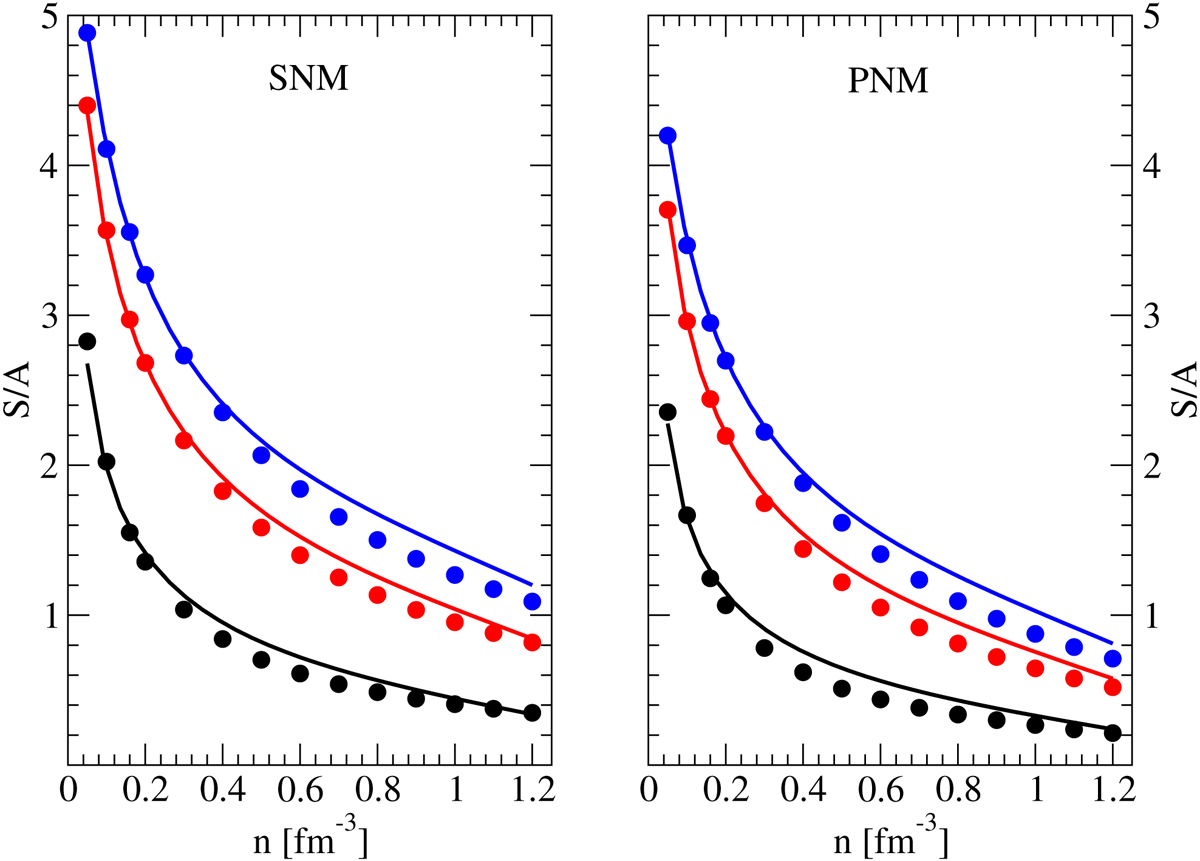
Entropy per nucleon (S/A) as a function of the nucleon density n at different temperatures, T = 20, 50, 70 MeV (from bottom to top) for SNM (left panel) and PNM (right panel). The continuous lines represent S/A calculated using Eq. (15) in which we employ the fit formula (Eq. (13)) for the free energy. The circular symbols represent the entropy per nucleon, calculated using Eq. (9) in the approximation of a mixture of two ideal Fermi gases of quasi-particles in the BHF mean fields.
Current usage metrics show cumulative count of Article Views (full-text article views including HTML views, PDF and ePub downloads, according to the available data) and Abstracts Views on Vision4Press platform.
Data correspond to usage on the plateform after 2015. The current usage metrics is available 48-96 hours after online publication and is updated daily on week days.
Initial download of the metrics may take a while.