| Issue |
A&A
Volume 646, February 2021
|
|
|---|---|---|
| Article Number | A125 | |
| Number of page(s) | 9 | |
| Section | Galactic structure, stellar clusters and populations | |
| DOI | https://doi.org/10.1051/0004-6361/202039441 | |
| Published online | 17 February 2021 | |
The Hubble Space Telescope UV Legacy Survey of Galactic Globular Clusters
XXII. Relative ages of multiple populations in five globular clusters
1
Departamento de Física, Faculdad de Ciencia Exactas, Universidad Andrés Bello, Fernández Concha 700, Santiago, Chile
e-mail: lucertini.fra@gmail.com
2
Aix Marseille Univ., CNRS, CNES, LAM, Marseille, France
3
Istituto Nazionale di Astrofisica – Osservatorio Astronomico di Padova, Vicolo dell’Osservatorio 5, Padova, IT 35122, Italy
4
Dipartimento di Fisica e Astronomia “Galileo Galilei”, Universitá di Padova, Vicolo dell’Osservatorio 3, Padova, IT 35122, Italy
Received:
15
September
2020
Accepted:
9
December
2020
Aims. We present a new technique to estimate the relative ages of multiple stellar populations hosted by the following five globular clusters: NGC 104 (47 Tuc), NGC 6121 (M 4), NGC 6352, NGC 6362, and NGC 6723.
Methods. We used the catalogs of the database HST UV Globular Cluster Survey to create color-magnitude and two-color diagrams of the globular clusters. We identified the multiple populations within each globular cluster, and we divided these into two main stellar populations: POPa, or first generation; and POPb, which is composed of all the successive generations of stars. This new technique allows us to obtain an accurate estimate of the relative ages between POPa and POPb.
Results. The multiple populations of NGC 104 and NGC 6121 are coeval within 220 Myr and 214 Myr, while those of NGC 6352, NGC 6362, and NGC 6723 are coeval within 336 Myr, 474 Myr, and 634 Myr, respectively. These results were obtained combining all the sources of uncertainties.
Key words: techniques: photometric / stars: Population II / globular clusters: general
© ESO 2021
1. Introduction
The concept that Galactic globular clusters (GCs) host multiple stellar populations is supported by an overwhelming amount of observational evidence and is accepted by the astronomical community. However, the origin and timescales for the formation and evolution of multiple populations (MPs) are continuing to be studied and are still a matter of debate. The most accredited scenarios support that the MPs phenomenon in GCs is due to multiple events of star formation. These formation scenarios consider the existence of a first generation (1G) characterized by stars that have chemical properties similar to those of the interstellar medium out of which they formed, and a second generation (2G) formed from the material processed by 1G stars. Among the proposed alternatives to explain 2G stars, the intermediate mass asymptotic giant branch (AGB) scenario (D’Antona et al. 2002) predicts that 2G stars were born from the AGB ejecta within 100 Myr (D’Ercole et al. 2012). On the other hand, de Mink et al. (2009) proposed that the 2G population was born from processed low-velocity material ejected by massive binaries in a timescale of ∼1 Myr. Suggesting supermassive stars with ℳ ∼ 104 M⊙ as 1G stars, Denissenkov & Hartwick (2014) demonstrated that 2G stars from in 105 yr. Therefore, the relative age of MPs can provide clues about the formation and evolution of these populations and can also discriminate among the various scenarios proposed.
In recent years, the investigation of MPs was expanded to GCs outside the Milky Way (MW). The fact that our Galaxy is not the only galaxy that hosts MPs allows us to compare GCs formed in systems with different star formation histories, providing clues about MPs phenomenon. Moreover, it turns out that the environment is not one primary requirement of MPs formation. Nardiello et al. (2019) analyzed the stellar populations within the GC Mayall II (G1), located in the halo of the nearby Andromeda galaxy. Several works focused on the discovery that intermediate-age (1−2 Gyr) clusters in the Magellanic Clouds show extended main-sequence (MS) turnoff and split MS (Saracino et al. 2019; Gilligan et al. 2019; Martocchia et al. 2019). Bastian & de Mink (2009) proposed the rotational velocity of stars with masses between 1.2 and 1.7 M⊙ to explain the presence of double MS. The age is another fundamental factor, since the lower age limit of a star cluster to show MPs is 2 Gyr (Martocchia et al. 2017). The MPs in the young star cluster NGC 1978 in the Magellanic Clouds are coeval within 1 ± 20 Myr (Martocchia et al. 2018). Similarly, Saracino et al. (2020) found that the star cluster NGC 2121 hosts coeval MPs within 6 ± 12 Myr. These results revealed that young GCs put tighter constraints than older GCs on the MPs formation timescale.
The treasury program Hubble Space Telescope (HST) UV Legacy Survey of Galactic Globular Clusters (GO-13297, PI: Piotto, Piotto et al. 2015) provided us with an unprecedented UV dataset of more than 50 GCs. The aim of the project was the photometric characterization of the MPs in GCs by combining the new UV data with optical HST data from the program ACS Survey of GCs (GO-10775, PI: Sarajedini, Sarajedini et al. 2006). Based on this dataset, Nardiello et al. (2015) developed a new procedure for evaluating the relative age of MPs within NGC 6352, assuming the different populations in the cluster have the same metallicity. Recently, Oliveira et al. (2020) employed a new code to provide a statistical fitting of isochrones to observed CMDs and to derive age differences between 1G and 2G in bulge GCs.
In this work, we present a new technique developed to estimate the relative age of MPs, using their MSTO as an indicator of age. We considered the following five GCs in this work: NGC 104 (47 Tuc), NGC 6121 (M 4), NGC 6352, NGC 6362, and NGC 6723. A proper identification of 1G stars and those of subsequent generations is a fundamental point for the application of our method. For this reason, we selected these objects because they show well-separated multiple sequences in their UV CMDs. The last three GCs of our sample were previously analyzed by Nardiello et al. (2015) and Oliveira et al. (2020), providing a direct evaluation of the method reliability.
The paper is organized as follows. Data reduction and analysis are briefly described in Sect. 2. In Sect. 3, we show the procedure adopted to characterize MPs within the GCs. In Sect. 4, the new method is explained. The results and comparison with literature are discussed in Sect. 5. Summary and conclusions follow in Sect. 6.
2. Observation and data reduction
In this work we used the catalogs obtained in the project HST UV Globular cluster Survey (HUGS1; Nardiello et al. 2018a). A detailed description of the data-reduction pipeline used to obtain these catalogs is provided in Bellini et al. (2017) and Nardiello et al. (2018b). The catalogs contain the positions of the stars, the magnitude in five filters (F275W, F336W, F438W, F606W, and F814W), and quality parameters such as the photometric errors in a filter X (σX), the quality of fit (QFIT), and the shape of the source (SHARP).
To analyze the MPs within GCs, we selected well-measured stars on the basis of these parameters, as done by Nardiello et al. (2018b). Briefly, we divided the sample of stars in a given filter X into bins of 0.5 mag and we calculated the 3σ-clipping median values in each bin. We interpolated these median values using a spline, and we rejected all the stars that are 3σ above (in the case of σX) or below (in the case of QFIT) the median parameters. Stars with −0.2 < SHARP < 0.2 were considered as well measured. All stars that satisfy the three conditions were selected and used during the analysis data.
We used the procedure described in Milone et al. (2012a) to correct the magnitudes for differential reddening. In the case of NGC 104, NGC 6362, and NGC 6723, the results obtained from this procedure do not lead either to a significant correction or to a considerable improvement of the CMDs. For this reason, we decided to continue the analysis without taking into consideration the differential reddening correction for these objects.
3. Multiple stellar populations within globular clusters
Since optical filters are less sensitive to light elements variations, such as C, N, and O, these filters allow us to identify MPs in CMDs only when metallicity and/or C+N+O content changes among the cluster stars (NGC 1851; Milone et al. 2012b; M 22 Milone et al. 2012b and M 2; Milone et al. 2015). Each cluster analyzed in this work hosts stars having all the same metallicities and C+N+O content, and in this manuscript we refer to MPs as the phenomenon due to the variation of light elements (C, N, O) among the cluster stars. In this context, the UV HST filters F275W, F336W, and F438W are efficient for the identification of MPs in GCs because they are sensitive to the variations of the molecular bands of OH, NH, CH, and CN.
Taking advantage of this possibility, we used a three-step process to select stars on the MS, sub-giant branch (SGB) and red-giant branch (RGB) and rejected those that are not on these three evolutionary phases. The GC NGC 6362 is taken as an example in Fig. 1. First, we selected the stars in the mF814W versus mF606W − mF814W CMD (top panels). We draw by hand two fiducial lines: one on the blue and one on the red side of each evolutionary phase. We rejected the stars lying on the left-hand side and on the right-hand side of the blue and red fiducial lines, respectively (gray points). The stars lying between the two fiducial lines and in a specific mF814W range were selected (black points). Then, we followed the same procedure in the mF814W versus mF336W − mF814W CMD, considering the previously selected stars (middle panels). In the final step, we selected, using the same approach, the stars in the mF814W versus mF275W − mF814W CMD (bottom panels).
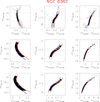 |
Fig. 1. Procedure adopted to select MS (left-hand panels), SGB (middle panels), and RGB stars (right-hand panels) in the mF814W vs. mF606W − mF814W (top panels), mF814W vs. mF336W − mF814W (middle panels), and mF814W vs. mF275W − mF814W (bottom panels) CMDs of NGC 6362. The hand-drawn fiducial lines of each evolutionary phase are reported in blue and red. The gray and black points represent rejected and selected stars, respectively. The mF814W magnitude ranges in which MS, SGB, and RGB stars were selected are shown by horizontal dashed lines in the top panels. |
For the final goal of this work, it is not necessary to perfectly separate all the MPs hosted by the GCs. We are interested in identifying a statistic amount of each population stars. For this reason, we divide the MPs of each GC into two main stellar populations. In particular, from now on, we refer to population-a (POPa) as the 1G stars (Na- and N- poor, and O- and C-rich) and to population-b (POPb) as successive generations.
Since our technique is based on the use of the MSTO color, we need to identify the bulk of POPa and POPb stars on the MS of each cluster. We applied a statistical identification based on the use of the pseudo-color CF275W, F336W, F438W = (mF275W − mF336W)−(mF336W − mF438W), which allowed us to maximize the separation between the different populations (see Milone et al. 2013). Figure 2 shows the procedure adopted. Well-measured stars are reported in gray, while black points are the selected MS stars. The blue and red fiducial lines are the 4th and 96th percentiles of the color distribution of MS stars. In order to obtain the fiducial lines, we divided the MS into a set of F814W magnitude bins of size δm, subdivided into sub-bins of δm/3. Moving iteratively of sub-bin, we calculated the 4th, 96th percentiles of the color distribution and the mean F814W magnitude within each bin. The points were smoothed with a boxcar averaging filter and interpolated with splines. In order to verticalize the pseudo-CMD, we transformed the CF275W, F336W, F438W color using the following equation:
where Y = CF275W, F336W, F438W, “fiducialR” and “fiducialB” are the red and blue fiducial lines. The distribution of stars in the mF814W vs. ΔCF275W, F336W, F438W diagram is represented by the histogram. Fitting a bimodal Gaussian profile, we identified the ΔCF275W, F336W, F438W value that is useful to separate the stars into the MPs which they belong to. The stars on the left- and right-hand sides of the cyan vertical line were classified as MSa and MSb, respectively. The two-color diagram mF336W − mF438W versus mF275W − mF336W of MS stars of each GC are shown in Figs. 3 and 4. We built the same diagrams for SGB and RGB stars of each GC. Since in the two-color diagrams of the two sequences of SGB and RGB stars are always clearly visible, in this case we divided the MPs drawing by hand a continuous line. We identified stars below and above the line as stars belonging to POPa (green) and stars belonging to POPb (magenta), respectively. The samples of stars that belong to POPa and POPb of each GC analyzed in this work are formed by the combination of MS, SGB, and RGB selected stars.
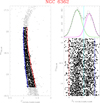 |
Fig. 2. Statistic separation of MS stars of the GC NGC 6362. In the mF814W vs. CF275W, F336W, F438W pseudo-CMD are reported well measured (gray) and MS selected (black) stars. The blue and red fiducial lines represent the 4th and 96th percentiles of the distribution in color. Bottom left panel: verticalized MS region. The histogram represents the stars distribution of the verticalized pseudo-CMD. The vertical cyan line is used to discriminate between MS of POPa (left-hand side) and Ms of POPb (right-hand side). |
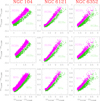 |
Fig. 3. Two-color diagram of mF336W−mF438W vs. mF275W − mF336W of MS (bottom panels), SGB (middle panels), and RGB (top panels) stars of POPa (green), and POPb (magenta) belonging to NGC 104 (left-hand panels), NGC 6121 (center panels), and NGC 6352 (right-hand panels). |
4. Relative age of MPs within the selected GCs
The analysis of relative ages of MPs allows us to improve our knowledge about the formation and evolution of the different populations hosted by GCs. In this work we propose a new technique to estimate the relative age of the two main populations, POPa and POPb, hosted by the following five GCs: NGC 104 (47 Tuc), NGC 6121 (M 4), NGC 6352, NGC 6362, and NGC 6723.
In the previous section, we took advantage of the UV filters to identify the two main populations hosted by our sample of GCs. To obtain the relative age between POPa and POPb, we considered them as simple stellar populations and we used the optical mF814W versus mF606W − mF814W CMD because (in first approximation) these filters are not affected by light element variations.
We estimated the relative age of the two populations comparing the observed MSTO color with theoretical models. Our technique is inspired by the horizontal method introduced by Rosenberg et al. (1999). This method considers a point on the RGB and the shape of this evolutionary phase mainly depends on the metallicity of the population. In “normal” GCs the different MPs have the same metal content within the errors, consequently, the point defined on the RGB is almost the same. In order to avoid the introduction of more photometric errors associated with the RGB color in the computation of relative ages, we used a method that does not take into account this point. The innovation of our method resides on the MSTO colors difference, imposing strong constraints on metallicity and helium content. In this way, we achieve a differential measure of age that is independent from distance and reddening.
4.1. Theoretical models
The procedure adopted to obtain the theoretical models is shown in Fig. 5, where NGC 6362 is taken as an example. For POPa, we considered a set of isochrones from the Dartmouth Stellar Evolution Database2 (DSED; Dotter et al. 2008) characterized by [Fe/H] = −1.07 (Massari et al. 2017), [α/Fe] = 0.4, primordial helium Yp = 0.2496, and ages that run from 10 000 to 15 000 Myr in steps of 100 Myr. The groups of 2G stars in GCs are helium enriched. Milone et al. (2018) determined the average and the maximum helium difference between 2G and 1G stars in a sample of 57 GCs, including our targets. These authors estimated a mean ΔY = 0.003 for NGC 6362 and we assumed this value as the helium difference between POPa and POPb of this cluster. To obtain a set of isochrones with the helium content expected for POPb, we interpolated the set of isochrones of POPa and a set with same value of [Fe/H], [α/Fe] and range in age, but with Y = 0.33. Panel a of Fig. 5 shows three isochrones calculated for an age of 12.5 Gyr, [Fe/H] = −1.07, [α/Fe] = 0.4, but different helium contents: the green model (POPa) has primordial helium Yp = 0.2496, while the red (for POPb) and blue models have Y = 0.2526 and Y = 0.33, respectively. We interpolated with a spline each isochrone of both the sets for POPa and POPb with a vector having absolute F814W magnitude 0 ≤ MF814W ≤ 6, whose points are evenly spaced by 0.001 mag. For each isochrone of each population, we identify the MS turnoff (MSTO) as the bluer point of the MS. To obtain a theoretical model appropriate for NGC 6362, we considered, for POPa, the isochrone having [Fe/H] = −1.07, [α/Fe] = 0.4, Yp = 0.2496, and absolute age 12.5 Gyr (Dotter et al. 2010) and, for POPb, the isochrones with the same value of [Fe/H] and [α/Fe], but Y = 0.2526 and all ages. We derived the difference in color between the MSTOs, δcTO, as the difference between the MSTO color of POPa and POPb. In panel b of Fig. 5 we show two cases to clarify this passage. The green isochrone represents POPa and corresponds to [Fe/H] = −1.07, [α/Fe] = 0.4, Yp = 0.2496 and an absolute age of 12.5 Gyr. The POPb is represented by the purple and cyan isochrones, which are calculated by assuming the same value of [Fe/H], [α/Fe] of POPa, Y = 0.2526, and ages 11 Gyr and 10 Gyr, respectively. The corresponding MSTOs of each isochrone are reported as dots, colored as their isochrone. The corresponding difference in color, δcTO, are shown as purple and cyan lines. We calculated ΔAge subtracting the MSTO age of all the isochrones of POPb from the MSTO age of POPa (i.e., the absolute age of 12.5 Gyr). The theoretical model δcTO versus ΔAge is reported in panel c of Fig. 5. The purple and cyan points represent the cases explained in panel b. To obtain a more robust model, we interpolated these points with a second-order polynomial, where the order was chosen to minimize the χ2 between the polynomial and the observed profile. In this way, we obtained the black theoretical model.
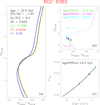 |
Fig. 5. Procedure adopted to obtain the reference theoretical models for NGC 6362. Panel a: three isochrones of 12.5 Gyr, for [Fe/H] = −1.07, [α/Fe] = 0.4 and different helium content. The red isochrone with Y = 0.2526 (helium-enriched by ΔY = 0.003) is obtained interpolating the isochrone with primordial helium, Yp = 0.2496 (green), with the Y = 0.33 helium-enriched one (blue). Panel b: difference in color among the MSTOs, from which the δcTO is calculated. The green isochrone is the same as in panel a and represents POPa. The purple and cyan isochrones have the same chemical content as the red isochrone of panel a, but are 11 Gyr and 10 Gyr, respectively. The corresponding δcTO of each case is a horizontal line. The theoretical model δcTO vs. ΔAge for NGC 6362 is shown in panel c. The purple and cyan points indicate the theoretical model values as obtained from the cases of panel b. |
Performing the same procedure and considering the values of [Fe/H] (Carretta et al. 2009 for NGC 104, NGC 6121, NGC 6723; Nardiello et al. 2015 for NGC 6352; Massari et al. 2017 for NGC 6362), [α/Fe], ΔY (Milone et al. 2018), and the absolute age (Dotter et al. 2010) reported in Table 1, we achieved the theoretical models of the other GCs. A different choice of α-enrichment strongly influences the trend of the models on the RGB, while the position of the MSTO changes insignificantly. Since the sum of light elements is constant, we can assume the same [α/Fe] value for POPa and POPb, making the relative MSTO position even more invariant.
[Fe/H] (Carretta et al. 2009 for NGC 104, NGC 2808, NGC 6121, NGC 6723; Nardiello et al. 2015 for NGC 6352; Massari et al. 2017 for NGC 6362), [α/Fe], mean difference in helium ΔY between POPa and POPb (Milone et al. 2018) and absolute age of POPa, Age(POPa), (Dotter et al. 2010), considered to obtain the theoretical model of each GC.
It is worth noting that the theoretical models are built assuming a fixed absolute age for POPa based on the Dotter et al. (2010) estimation, whose uncertainties are of 0.5 Gyr. In Appendix A, we evaluate how the theoretical model is affected by this error, and we prove that it does not influence the final relative age result.
4.2. Relative age
To obtain the relative age between POPa and POPb within the five GCs, we compared the theoretical models and the observed δcTO values, as shown in Figs. 6 and 7. The GC NGC 6362 in the middle panel of Fig. 7 is taken as an example to explain this step. We measured the color and magnitude of the MSTOs of POPa and POPb in the mF814W versus mF606W − mF814W CMD. The MSTO of each population were obtained using fiducial lines: we divided the MS F814W magnitudes regime 17.8 ≤ mF814W ≤ 19.3 of NGC 6362 in bins of 0.3 mag. In each bin, we calculated the median magnitude and color with a 3σ-clipping procedure. The median points were smoothed with boxcar averaging filter having a window of 3 points and then were interpolated with a spline to obtain the fiducial line. The MSTO of each population is the bluer point of the corresponding fiducial line. We found that the color and F814W magnitude of the MSTOs of POPa and POPb of NGC 6362 are (0.540 ± 0.001, 18.200 ± 0.008) and (0.539 ± 0.001, 18.175 ± 0.009), respectively. Furthermore, we calculated the value of δcTO = 0.001 ± 0.001 for NGC 6362. The uncertainty on this last value was estimated as the standard deviation from the mean value. In the mF814W versus mF606W − mF814W CMD of NGC 6362 (Fig. 7), POPa and POPb are shown in green and magenta and their respective MSTOs are reported as filled circles colored as the population they belong to.
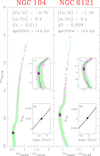 |
Fig. 6. Application of our technique to estimate the relative ages of MPs in NGC 104 and NGC 6121. In the observed mF814W vs. mF606W − mF814W CMDs POPa (green), POPb (magenta), and their respective MSTOs are plotted. The inserts (a) show a zoomed of the MSTO region. The blue and red fiducial lines are representative of POPa and POPb, respectively. The theoretical models in the insert (b) were obtained assuming the parameters list on the top of the figure. |
The MSTO colors and F814W magnitudes and the observed δcTO obtained for the five GCs considered in this work are reported in Table 2.
Value of color and magnitude of MSTO and observed δcTO obtained for POPa and POPb within GCs.
In order to estimate the relative age between POPa and POPb in NGC 6362, in the insert of Fig. 7, we show the observed δcTO on the theoretical model. We concluded that the two main populations of NGC 6362 have a difference in age ΔAge = 73 ± 92 Myr. The uncertainty associated with this estimation of relative age was obtained by interpolating the δcTO errors with the theoretical model; the uncertainty is only due to internal errors.
In addition to these internal errors, we analyzed how the helium uncertainty, σΔY = ±0.011 (Milone et al. 2018), and the metallicity uncertainty, σ[Fe/H] = ±0.05 (Massari et al. 2017), affect the measurement of ΔAge. We produced two additional sets of isochrones for POPb characterized by the same [Fe/H] = −1.07 and [α/Fe] = 0.4 of POPa, but with two different helium enhancements: ΔY = 0.003 + 0.011 = 0.014 and ΔY = 0.003−0.011 = −0.008. We extracted the theoretical models, adopting these two helium enhanced isochrones for POPb and the same isochrone as used above for POPa. Following the procedure previously outlined and comparing the observed δcTO with these models, we found that an uncertainty of ±0.011 dex in ΔY leads to an uncertainty on ΔAge of σΔAge(ΔY) = ± 126 Myr. Similarly, we calculated the impact of [Fe/H] variations on the estimate of ΔAge. In this case, we used for POPb two sets of isochrones with [α/Fe] = 0.4, which are enhanced in helium by ΔY = 0.003, but have different metallicities; these two sets of isochones are [Fe/H] = −1.07 + 0.05 = − 1.02 and [Fe/H] = −1.07−0.05 = − 1.12. We found that an error of σ[Fe/H] = ±0.05 produce an uncertainty σΔAge([Fe/H]) = 448 Myr.
Combining all the sources of uncertainties we can establish an upper limit for the uncertainty of the relative age between the two main populations within the cluster. We found that POPa and POPb of NGC 6362 are coeval within ∼474 Myr. We performed the same procedure for the others GCs using the values reported in Table 1. The final results are summarized in Table 3.
MPs relative ages and their uncertainties.
5. Discussion
The mechanisms that have brought to the formation of MPs in GCs are still the subject of debate. Despite the increasing interest in this topic in the last couple of decades, further and deeper analyses are needed. This work aims to introduce a new technique that can contribute toward shedding light on this astronomical issue. A good relative age estimate of MPs leads to clues regarding the formation and the evolution of these populations.
In the literature, most of the works on the relative age of MPs concern GCs with a large variation of metallicity between different populations. According to Marino et al. (2012), M 22 hosts MPs that are coeval within ∼300 Myr. Studying the GC NGC 2419, Lee et al. (2013) showed that this object hosts two stellar populations that are characterized by a large difference in metallicity and helium abundance. These authors found that the most metal-rich population is younger than 2 Gyr. The relative ages of the MPs in NGC 2808 were analyzed by Roh et al. (2011); they found that, if 2G stars are helium and metal enhanced by ΔY = 0.03 and ΔY = 0.16, respectively, compared to 1G stars, then the 2G population is ∼1.5 Gyr younger than the 1G population.
Using HST data, Souza et al. (2020) estimated an age difference of 550 ± 410 Myr between the first and the third generations in NGC 6752. The uncertainty of their result decreases to 400 Myr when the helium enhancement is considered.
We compare the results in the literature with what we obtained in this work, in cases in which the same source of uncertainties were taken into account. Nardiello et al. (2015) applied isochrone fitting over synthetic CMDs with χ2 calculations to evaluate the relative age of MPs within NGC 6352. Assuming [Fe/H] = −0.67, [α/Fe] = +0.4 and ΔY = 0.029, these authors derived an age difference of 10 ± 110 Myr. Considering the same value of metallicity and α-enhancement and ΔY = 0.019, we estimated ΔAge = 273 ± 150 Myr for NGC 6352. Adopting a difference in [Fe/H] and [α/Fe] of 0.02 dex, Nardiello et al. (2015) found that the two populations are coeval within ∼300 Myr. This result is perfectly in agreement with our value of σΔAge = 336 Myr, when all the uncertainties are considered.
Recently, Oliveira et al. (2020) used statistical isochrone fitting to estimate the relative age of MPs within the following eight GCs: NGC 6304, NGC 6352, NGC 6362, NGC 6624, NGC 6637, NGC 6652, NGC 6717, and NGC 6723. These authors found that the individual MPs are coeval within 500 Myr. Moreover, they derived a weighted mean age difference of 41 ± 170 Myr adopting canonical He abundances, which reduces to 17 ± 170 when He-enhancement is taken into account.
Considering [Fe/H] = −0.59, [α/Fe] = +0.2 and ΔY = 0.027, they derived an age difference of 500 ± 480 Myr for NGC 6352. This estimation is comparable to our of 273 ± 150 Myr. Assuming 2G He-enriched by ΔY = 0.004, Oliveira et al. (2020) found that the relative age of MPs in NGC 6362 is −200 ± 410 Myr. Using ΔY = 0.003, we estimated ΔAge = 73 ± 92 Myr. Even though our mean differential age estimation is slightly higher, our value agrees within 1σ with that obtained by Oliveira et al. (2020). Finally, we found ΔAge = 25 ± 65 Myr for the MPs in NGC 6723, which is in agreement with the difference in age −100 ± 510 Myr obtained by Oliveira et al. (2020). In Fig. 8, this work and in the literature results for GCs in common are compared. We conclude that our new technique leads to consistent result with those in the literature and with, on average, smaller error bars.
 |
Fig. 8. Comparison between this work results (blue) with those obtained by Nardiello et al. (2015) (green) and Oliveira et al. (2020) (red) for NGC 6352, NGC 6362, and NGC 6723. The errors bars of NGC 6352* include all the uncertainties, while those of the other results consider only the uncertainty on ΔY. |
6. Conclusions
We developed a new technique to estimate the relative ages of the MPs hosted by GCs. In this work, we applied the method to the following five clusters: NGC 104, NGC 6121, NGC 6352, NGC 6362, and NGC 6723. We used the astro-photometric catalogs released by Nardiello et al. (2018a) and we selected the well-measured stars on the basis of their photometric parameters.
A statistical test was used to divide the MPs along the MS of the GCs. We built the mF336W − mF438W versus mF275W − mF336W two-color diagram of SGB and RGB stars to divide the stars in the different evolutionary phases into the populations to which they belong. We defined POPa as the 1G stars and POPb as all the successive generations of stars, and we considered these two groups of stars as simple stellar populations to estimate their relative age.
Considering the values of [Fe/H], [α/Fe], Y reported in Table 1, we built the δcTO versus ΔAge theoretical model for each GCs. We defined δcTO as the difference in color between the MSTO color of a fixed isochrone age for POPa and the MSTO of all ages isochrones for POPb and the ΔAge as the difference between a fixed age of POPa and all the ages of POPb. The observed δcTO was calculated in the mF814W versus mF606W − mF814W CMD, and we obtained the relative age between the two main populations.
The conclusions drawn from our new technique are as follows:
-
An uncertainty of ±0.5 Gyr (Dotter et al. 2010) on the absolute age of POPa does not affect the final value of the relative ages (see Appendix A).
-
Combining all the sources of uncertainties (photometry, metallicity, and He-enrichment) we estimated an upper limit on the relative ages. We found that the MPs of NGC 104 and NGC 6121 are coeval within 220 Myr and 214 Myr, while those of NGC 6352, NGC 6362, and NGC 6723 are coeval within 336 Myr, 474 Myr, and 634 Myr.
-
Within the limits of the errors on relative ages above indicated, the different populations in the single clusters are coeval.
The results obtained with our technique are consistent with those in the literature. We can affirm that the new method is a good tool to estimate relative ages of MPs within GCs. Finally, our results give new observational evidence to put constraints on the formation of MPs in GCs. Several theoretical scenarios have been proposed to explain this astronomical topic, even if none are able to explain all the observational facts obtained in recent years (Renzini et al. 2015). The most accredited scenarios involve intermediate massive AGB stars (D’Antona et al. 2002; D’Ercole et al. 2012), fast-rotating massive stars (Decressin et al. 2007a,b), massive interacting binaries (de Mink et al. 2009; Bastian et al. 2013), or supermassive stars (Denissenkov & Hartwick 2014; Denissenkov et al. 2015). According to these scenarios, the timescales for the formation of the other populations run from a few million years to some hundred Myr. Unfortunately, with the results obtained in this work we cannot discriminate which scenario is the most appropriate to describe the formation of MPs. In any case, by joining our results with the relative ages measured in previous works, we can put a strong constraint on the MPs phenomenon: the formation of MPs happens on the same timescale for all the normal GCs.
Acknowledgments
DNa acknowledges the support from the French Centre National d’Etudes Spatiales (CNES).
References
- Bastian, N., & de Mink, S. E. 2009, MNRAS, 398, L11 [NASA ADS] [CrossRef] [Google Scholar]
- Bastian, N., Lamers, H. J. G. L. M., de Mink, S. E., et al. 2013, MNRAS, 436, 2398 [NASA ADS] [CrossRef] [MathSciNet] [Google Scholar]
- Bellini, A., Anderson, J., Bedin, L. R., et al. 2017, ApJ, 842, 6 [NASA ADS] [CrossRef] [Google Scholar]
- Carretta, E., Bragaglia, A., Gratton, R. G., et al. 2009, A&A, 505, 117 [NASA ADS] [CrossRef] [EDP Sciences] [Google Scholar]
- D’Antona, F., Caloi, V., Montalbán, J., Ventura, P., & Gratton, R. 2002, A&A, 395, 69 [NASA ADS] [CrossRef] [EDP Sciences] [Google Scholar]
- de Mink, S. E., Pols, O. R., Langer, N., & Izzard, R. G. 2009, A&A, 507, L1 [NASA ADS] [CrossRef] [EDP Sciences] [Google Scholar]
- Decressin, T., Charbonnel, C., & Meynet, G. 2007a, A&A, 475, 859 [NASA ADS] [CrossRef] [EDP Sciences] [Google Scholar]
- Decressin, T., Meynet, G., Charbonnel, C., Prantzos, N., & Ekström, S. 2007b, A&A, 464, 1029 [NASA ADS] [CrossRef] [EDP Sciences] [Google Scholar]
- Denissenkov, P. A., & Hartwick, F. D. A. 2014, MNRAS, 437, L21 [NASA ADS] [CrossRef] [Google Scholar]
- Denissenkov, P. A., VandenBerg, D. A., Hartwick, F. D. A., et al. 2015, MNRAS, 448, 3314 [NASA ADS] [CrossRef] [Google Scholar]
- D’Ercole, A., D’Antona, F., Carini, R., Vesperini, E., & Ventura, P. 2012, MNRAS, 423, 1521 [NASA ADS] [CrossRef] [Google Scholar]
- Dotter, A., Chaboyer, B., Jevremović, D., et al. 2008, ApJS, 178, 89 [Google Scholar]
- Dotter, A., Sarajedini, A., Anderson, J., et al. 2010, ApJ, 708, 698 [NASA ADS] [CrossRef] [Google Scholar]
- Gilligan, C. K., Chaboyer, B., Cummings, J. D., et al. 2019, MNRAS, 486, 5581 [CrossRef] [Google Scholar]
- Lee, Y.-W., Han, S.-I., Joo, S.-J., et al. 2013, ApJ, 778, L13 [NASA ADS] [CrossRef] [Google Scholar]
- Marino, A. F., Milone, A. P., Sneden, C., et al. 2012, A&A, 541, A15 [NASA ADS] [CrossRef] [EDP Sciences] [Google Scholar]
- Martocchia, S., Bastian, N., Usher, C., et al. 2017, MNRAS, 468, 3150 [NASA ADS] [CrossRef] [Google Scholar]
- Martocchia, S., Niederhofer, F., Dalessandro, E., et al. 2018, MNRAS, 477, 4696 [NASA ADS] [CrossRef] [Google Scholar]
- Martocchia, S., Dalessandro, E., Lardo, C., et al. 2019, MNRAS, 487, 5324 [NASA ADS] [CrossRef] [Google Scholar]
- Massari, D., Mucciarelli, A., Dalessandro, E., et al. 2017, MNRAS, 468, 1249 [NASA ADS] [CrossRef] [Google Scholar]
- Milone, A. P., Piotto, G., Bedin, L. R., et al. 2012a, A&A, 540, A16 [NASA ADS] [CrossRef] [EDP Sciences] [Google Scholar]
- Milone, A. P., Piotto, G., Bedin, L. R., et al. 2012b, Mem. Soc. Astron. It. Suppl., 19, 173 [NASA ADS] [Google Scholar]
- Milone, A. P., Marino, A. F., Piotto, G., et al. 2013, ApJ, 767, 120 [NASA ADS] [CrossRef] [Google Scholar]
- Milone, A. P., Marino, A. F., Piotto, G., et al. 2015, MNRAS, 447, 927 [NASA ADS] [CrossRef] [Google Scholar]
- Milone, A. P., Marino, A. F., Renzini, A., et al. 2018, MNRAS, 481, 5098 [NASA ADS] [CrossRef] [Google Scholar]
- Nardiello, D., Piotto, G., Milone, A. P., et al. 2015, MNRAS, 451, 312 [NASA ADS] [CrossRef] [Google Scholar]
- Nardiello, D., Libralato, M., Piotto, G., et al. 2018a, MNRAS, 481, 3382 [NASA ADS] [CrossRef] [Google Scholar]
- Nardiello, D., Milone, A. P., Piotto, G., et al. 2018b, MNRAS, 477, 2004 [NASA ADS] [CrossRef] [Google Scholar]
- Nardiello, D., Piotto, G., Milone, A. P., et al. 2019, MNRAS, 485, 3076 [NASA ADS] [CrossRef] [Google Scholar]
- Oliveira, R. A. P., Souza, S. O., Kerber, L. O., et al. 2020, ApJ, 891, 37 [CrossRef] [Google Scholar]
- Piotto, G., Milone, A. P., Bedin, L. R., et al. 2015, AJ, 149, 91 [NASA ADS] [CrossRef] [Google Scholar]
- Renzini, A., D’Antona, F., Cassisi, S., et al. 2015, MNRAS, 454, 4197 [NASA ADS] [CrossRef] [Google Scholar]
- Roh, D.-G., Lee, Y.-W., Joo, S.-J., et al. 2011, ApJ, 733, L45 [NASA ADS] [CrossRef] [Google Scholar]
- Rosenberg, A., Saviane, I., Piotto, G., & Aparicio, A. 1999, AJ, 118, 2306 [NASA ADS] [CrossRef] [Google Scholar]
- Saracino, S., Bastian, N., Kozhurina-Platais, V., et al. 2019, MNRAS, 489, L97 [NASA ADS] [CrossRef] [Google Scholar]
- Saracino, S., Martocchia, S., Bastian, N., et al. 2020, MNRAS, 493, 6060 [CrossRef] [Google Scholar]
- Sarajedini, A., Anderson, J., Aparicio, A., et al. 2006, BAAS, 38, 1044 [Google Scholar]
- Souza, S. O., Kerber, L. O., Barbuy, B., et al. 2020, ApJ, 890, 38 [CrossRef] [Google Scholar]
Appendix A: Theoretical model
The relative age values are given comparing the observed δcTO and theoretical models. The theoretical models are based on an assumption on the absolute age of POPa. In this work, we adopted the ages obtained by Dotter et al. (2010), which have on average an uncertainty of ±0.5 Gyr. This appendix aims to investigate how the error on the POPa age affects the theoretical model and, consequently, the relative age estimate.
With this purpose, we take the GC NGC 6362 as example. In this cluster, we assumed, for POPa, an isochrone characterized by [Fe/H] = −1.07 (Massari et al. 2017), [α/Fe] = +0.4, primordial helium Y = 0.2496, and age 12.5 Gyr (Dotter et al. 2010). On the other hand, the set of isochrones for POPb has the same [Fe/H] and [α/Fe], He-enrichment ΔY = 0.003 (Milone et al. 2018), and ages that run from 10 000 Myr to 15 000 Myr, in steps of 100 Myr. As described in Sect. 4.1 and Fig. 5, we derived the theoretical model for this GC, as shown in Fig. A.1 in magenta. Reporting the observed δcTO on this profile, we obtained a relative age of 73 ± 92 Myr. The same figure shows the theoretical models obtained considering an age of 12 Gyr (cyan) and 13 Gyr (green) for POPa. As shown in the insert, there is a negligible difference among the three models in the region in which the observed δcTO lies. The relative ages found considering the cyan and green models are 84 ± 87 Myr and 78 ± 97 Myr, respectively. We conclude that an uncertainty of ±0.5 Gyr on the absolute age of POPa does not affect the final relative age result.
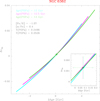 |
Fig. A.1. Application of the new technique to estimate the relative age of MPs within NGC 6362. The theoretical models were obtained considering POPa ages of 12 Gyr (cyan), 12.5 Gyr (magenta) and 13 Gyr (green). A better comparison between the three models is shown in the insert. |
Furthermore, we performed a deeper analysis to evaluate how the choice of POPa age affects the theoretical model. We applied the method for NGC 6362 considering POPa ages of 10.5 Gyr (blue) and 14.5 Gyr (orange), as shown in Fig. A.2. From these cases, we estimated relative ages of 62 ± 75 Myr and 107 ± 118 Myr, respectively. Despite the inclination variation of the theoretical model, the final results are consistent within error bars. We can affirm that a different choice of POPa age within ±2 Gyr, which is the typical range of GC ages, does not affect the relative age value estimated with our technique.
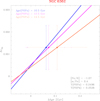 |
Fig. A.2. Application of the new technique to estimate the relative age of MPs within NGC 6362. The theoretical models were obtained considering POPa ages of 10.5 Gyr (blue), 12.5 Gyr (magenta), and 14.5 Gyr (orange). |
All Tables
[Fe/H] (Carretta et al. 2009 for NGC 104, NGC 2808, NGC 6121, NGC 6723; Nardiello et al. 2015 for NGC 6352; Massari et al. 2017 for NGC 6362), [α/Fe], mean difference in helium ΔY between POPa and POPb (Milone et al. 2018) and absolute age of POPa, Age(POPa), (Dotter et al. 2010), considered to obtain the theoretical model of each GC.
Value of color and magnitude of MSTO and observed δcTO obtained for POPa and POPb within GCs.
All Figures
 |
Fig. 1. Procedure adopted to select MS (left-hand panels), SGB (middle panels), and RGB stars (right-hand panels) in the mF814W vs. mF606W − mF814W (top panels), mF814W vs. mF336W − mF814W (middle panels), and mF814W vs. mF275W − mF814W (bottom panels) CMDs of NGC 6362. The hand-drawn fiducial lines of each evolutionary phase are reported in blue and red. The gray and black points represent rejected and selected stars, respectively. The mF814W magnitude ranges in which MS, SGB, and RGB stars were selected are shown by horizontal dashed lines in the top panels. |
| In the text | |
 |
Fig. 2. Statistic separation of MS stars of the GC NGC 6362. In the mF814W vs. CF275W, F336W, F438W pseudo-CMD are reported well measured (gray) and MS selected (black) stars. The blue and red fiducial lines represent the 4th and 96th percentiles of the distribution in color. Bottom left panel: verticalized MS region. The histogram represents the stars distribution of the verticalized pseudo-CMD. The vertical cyan line is used to discriminate between MS of POPa (left-hand side) and Ms of POPb (right-hand side). |
| In the text | |
 |
Fig. 3. Two-color diagram of mF336W−mF438W vs. mF275W − mF336W of MS (bottom panels), SGB (middle panels), and RGB (top panels) stars of POPa (green), and POPb (magenta) belonging to NGC 104 (left-hand panels), NGC 6121 (center panels), and NGC 6352 (right-hand panels). |
| In the text | |
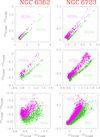 |
Fig. 4. As in Fig. 3 for the GCs NGC 6362 (left-hand panels) and NGC 6723 (right-hand panels). |
| In the text | |
 |
Fig. 5. Procedure adopted to obtain the reference theoretical models for NGC 6362. Panel a: three isochrones of 12.5 Gyr, for [Fe/H] = −1.07, [α/Fe] = 0.4 and different helium content. The red isochrone with Y = 0.2526 (helium-enriched by ΔY = 0.003) is obtained interpolating the isochrone with primordial helium, Yp = 0.2496 (green), with the Y = 0.33 helium-enriched one (blue). Panel b: difference in color among the MSTOs, from which the δcTO is calculated. The green isochrone is the same as in panel a and represents POPa. The purple and cyan isochrones have the same chemical content as the red isochrone of panel a, but are 11 Gyr and 10 Gyr, respectively. The corresponding δcTO of each case is a horizontal line. The theoretical model δcTO vs. ΔAge for NGC 6362 is shown in panel c. The purple and cyan points indicate the theoretical model values as obtained from the cases of panel b. |
| In the text | |
 |
Fig. 6. Application of our technique to estimate the relative ages of MPs in NGC 104 and NGC 6121. In the observed mF814W vs. mF606W − mF814W CMDs POPa (green), POPb (magenta), and their respective MSTOs are plotted. The inserts (a) show a zoomed of the MSTO region. The blue and red fiducial lines are representative of POPa and POPb, respectively. The theoretical models in the insert (b) were obtained assuming the parameters list on the top of the figure. |
| In the text | |
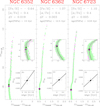 |
Fig. 7. As in Fig. 6, for the GCs NGC 6352, NGC 6362, and NGC 6723. |
| In the text | |
 |
Fig. 8. Comparison between this work results (blue) with those obtained by Nardiello et al. (2015) (green) and Oliveira et al. (2020) (red) for NGC 6352, NGC 6362, and NGC 6723. The errors bars of NGC 6352* include all the uncertainties, while those of the other results consider only the uncertainty on ΔY. |
| In the text | |
 |
Fig. A.1. Application of the new technique to estimate the relative age of MPs within NGC 6362. The theoretical models were obtained considering POPa ages of 12 Gyr (cyan), 12.5 Gyr (magenta) and 13 Gyr (green). A better comparison between the three models is shown in the insert. |
| In the text | |
 |
Fig. A.2. Application of the new technique to estimate the relative age of MPs within NGC 6362. The theoretical models were obtained considering POPa ages of 10.5 Gyr (blue), 12.5 Gyr (magenta), and 14.5 Gyr (orange). |
| In the text | |
Current usage metrics show cumulative count of Article Views (full-text article views including HTML views, PDF and ePub downloads, according to the available data) and Abstracts Views on Vision4Press platform.
Data correspond to usage on the plateform after 2015. The current usage metrics is available 48-96 hours after online publication and is updated daily on week days.
Initial download of the metrics may take a while.


