Fig. 2.
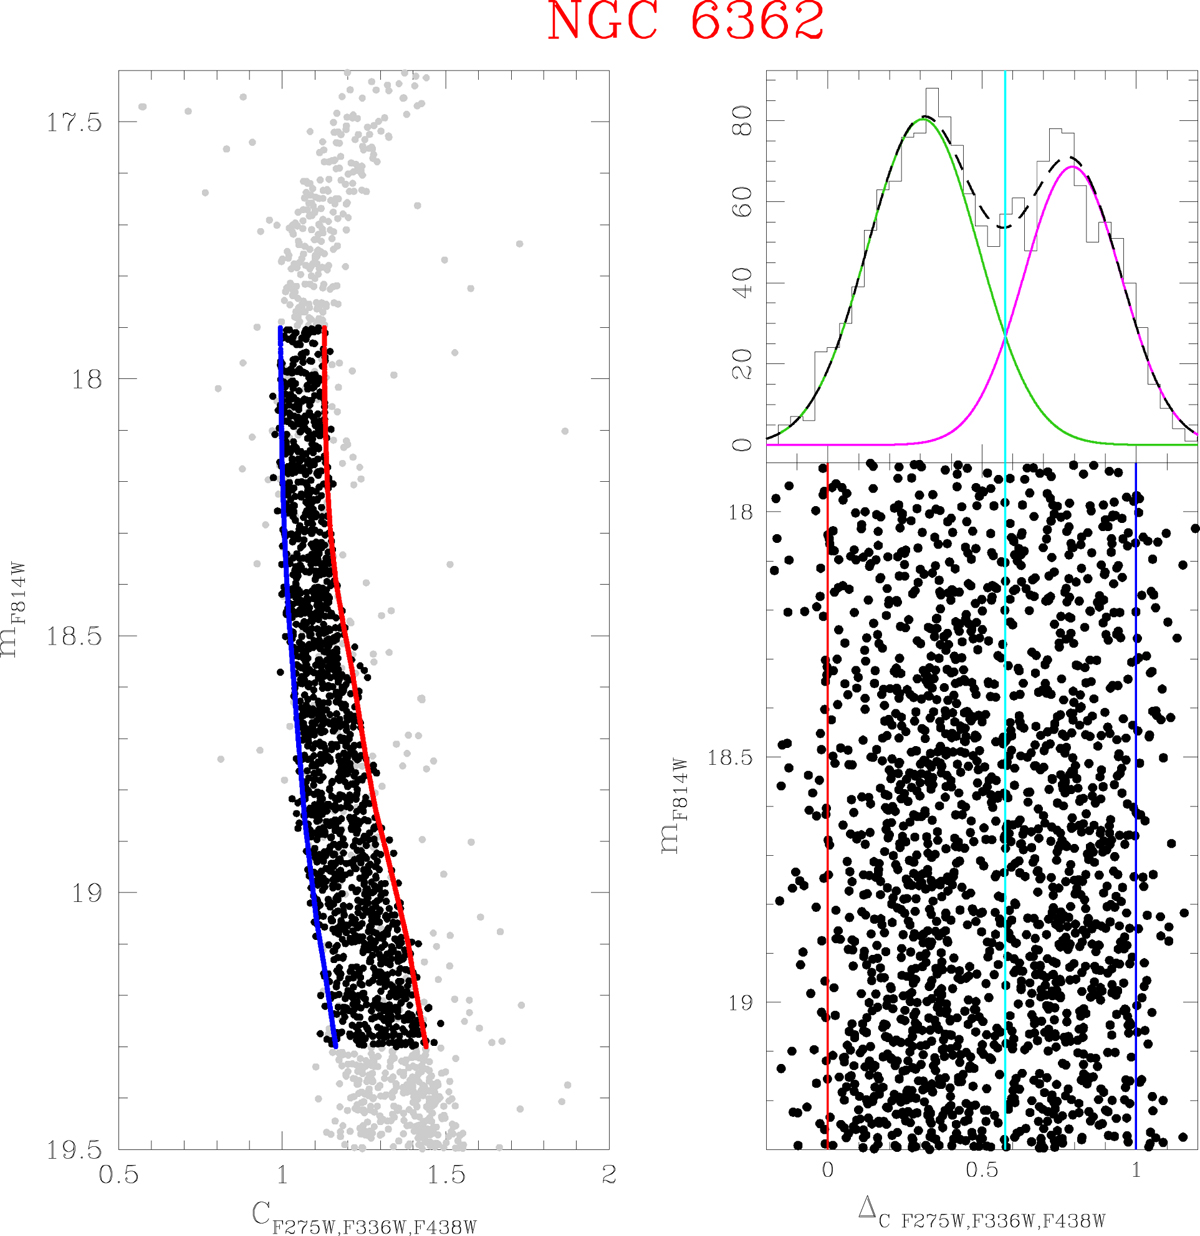
Statistic separation of MS stars of the GC NGC 6362. In the mF814W vs. CF275W, F336W, F438W pseudo-CMD are reported well measured (gray) and MS selected (black) stars. The blue and red fiducial lines represent the 4th and 96th percentiles of the distribution in color. Bottom left panel: verticalized MS region. The histogram represents the stars distribution of the verticalized pseudo-CMD. The vertical cyan line is used to discriminate between MS of POPa (left-hand side) and Ms of POPb (right-hand side).
Current usage metrics show cumulative count of Article Views (full-text article views including HTML views, PDF and ePub downloads, according to the available data) and Abstracts Views on Vision4Press platform.
Data correspond to usage on the plateform after 2015. The current usage metrics is available 48-96 hours after online publication and is updated daily on week days.
Initial download of the metrics may take a while.