Fig. 8
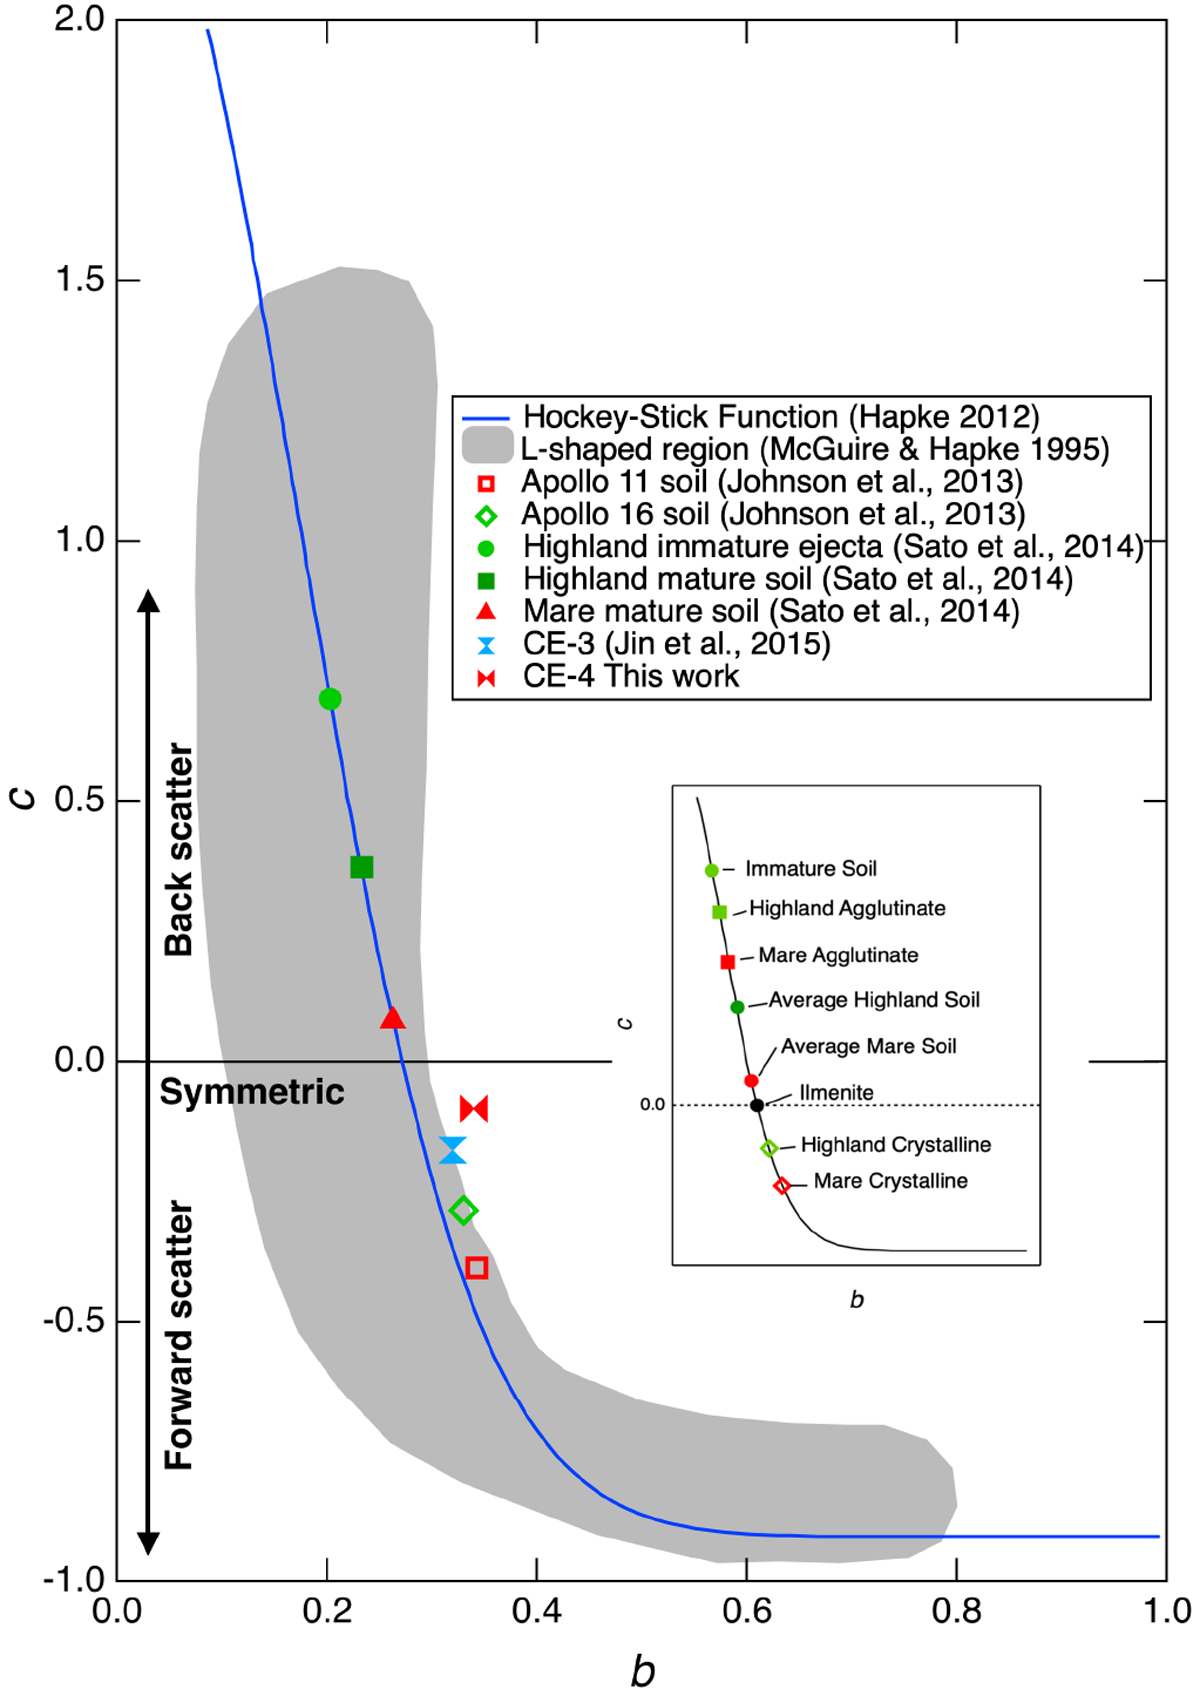
Typical values of b and c (Henyey-Greenstein phase-function parameters) for the mature mare (low and high Ti content), the mature highland, and the immature highland ejecta in 643 nm band parameter maps by Sato et al. (2014). The red horizontal double triangle indicates the b and c values derived in B.2. The blue vertical double triangle represents the b and c values of CE-3 in Jin et al. (2015).
Current usage metrics show cumulative count of Article Views (full-text article views including HTML views, PDF and ePub downloads, according to the available data) and Abstracts Views on Vision4Press platform.
Data correspond to usage on the plateform after 2015. The current usage metrics is available 48-96 hours after online publication and is updated daily on week days.
Initial download of the metrics may take a while.