Fig. 5
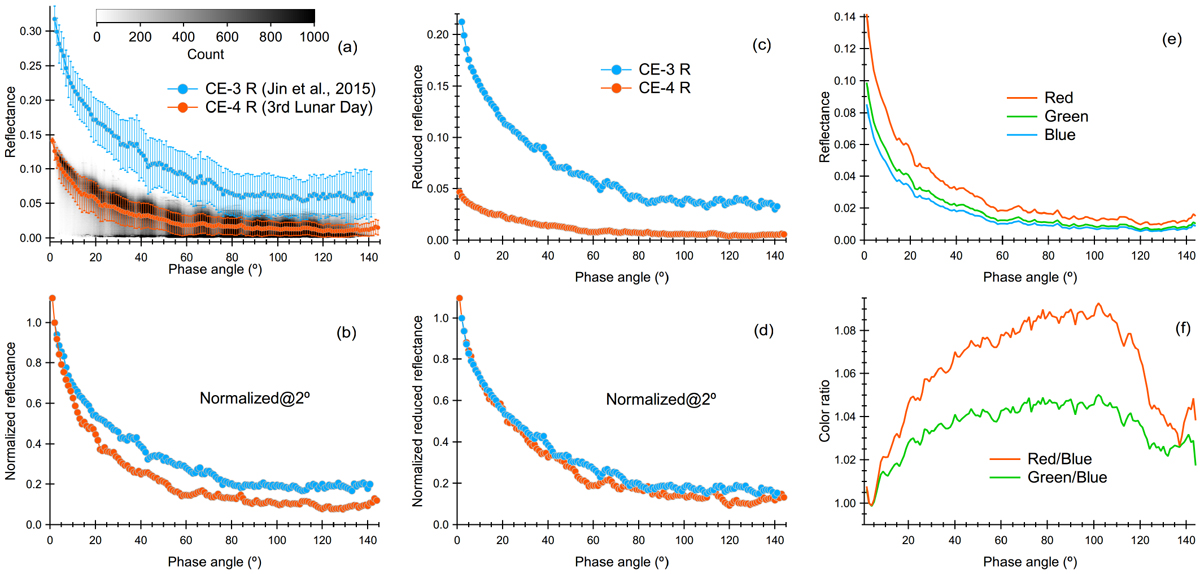
Extracted phase curves and color ratio curves. (a) Comparisons of the CE-4 (orange, this work) and CE-3 (blue, Jin et al. 2015) phase curves in the R band (640 nm). For CE-4 data, the gray color dots represent pixel densities (with a bin width of 0.375 on the phase-angle axis and 0.000375 on the reflectance axis) of the original reflectance values and the red curve with error bars is the averaged value within a 1° phase angle; and (b) reflectance in the R band (640 nm) normalized at a 2° phase angle. We note that the minimum phase angle of the CE-4 phase curve is 1°, while that of CE-3 is 2°. (c) Reduced reflectance values obtained from Eq. (3); (d) reduced reflectance normalized at a 2° phase angle;(e) extracted phase curves in three colors for CE-4: red (R, 640 nm), green (G, the average of two 540 nm channels G1and G2), and blue (B, 470 nm); and (f) color ratios of red over blue and green over blue for CE-4.
Current usage metrics show cumulative count of Article Views (full-text article views including HTML views, PDF and ePub downloads, according to the available data) and Abstracts Views on Vision4Press platform.
Data correspond to usage on the plateform after 2015. The current usage metrics is available 48-96 hours after online publication and is updated daily on week days.
Initial download of the metrics may take a while.