Fig. 2.
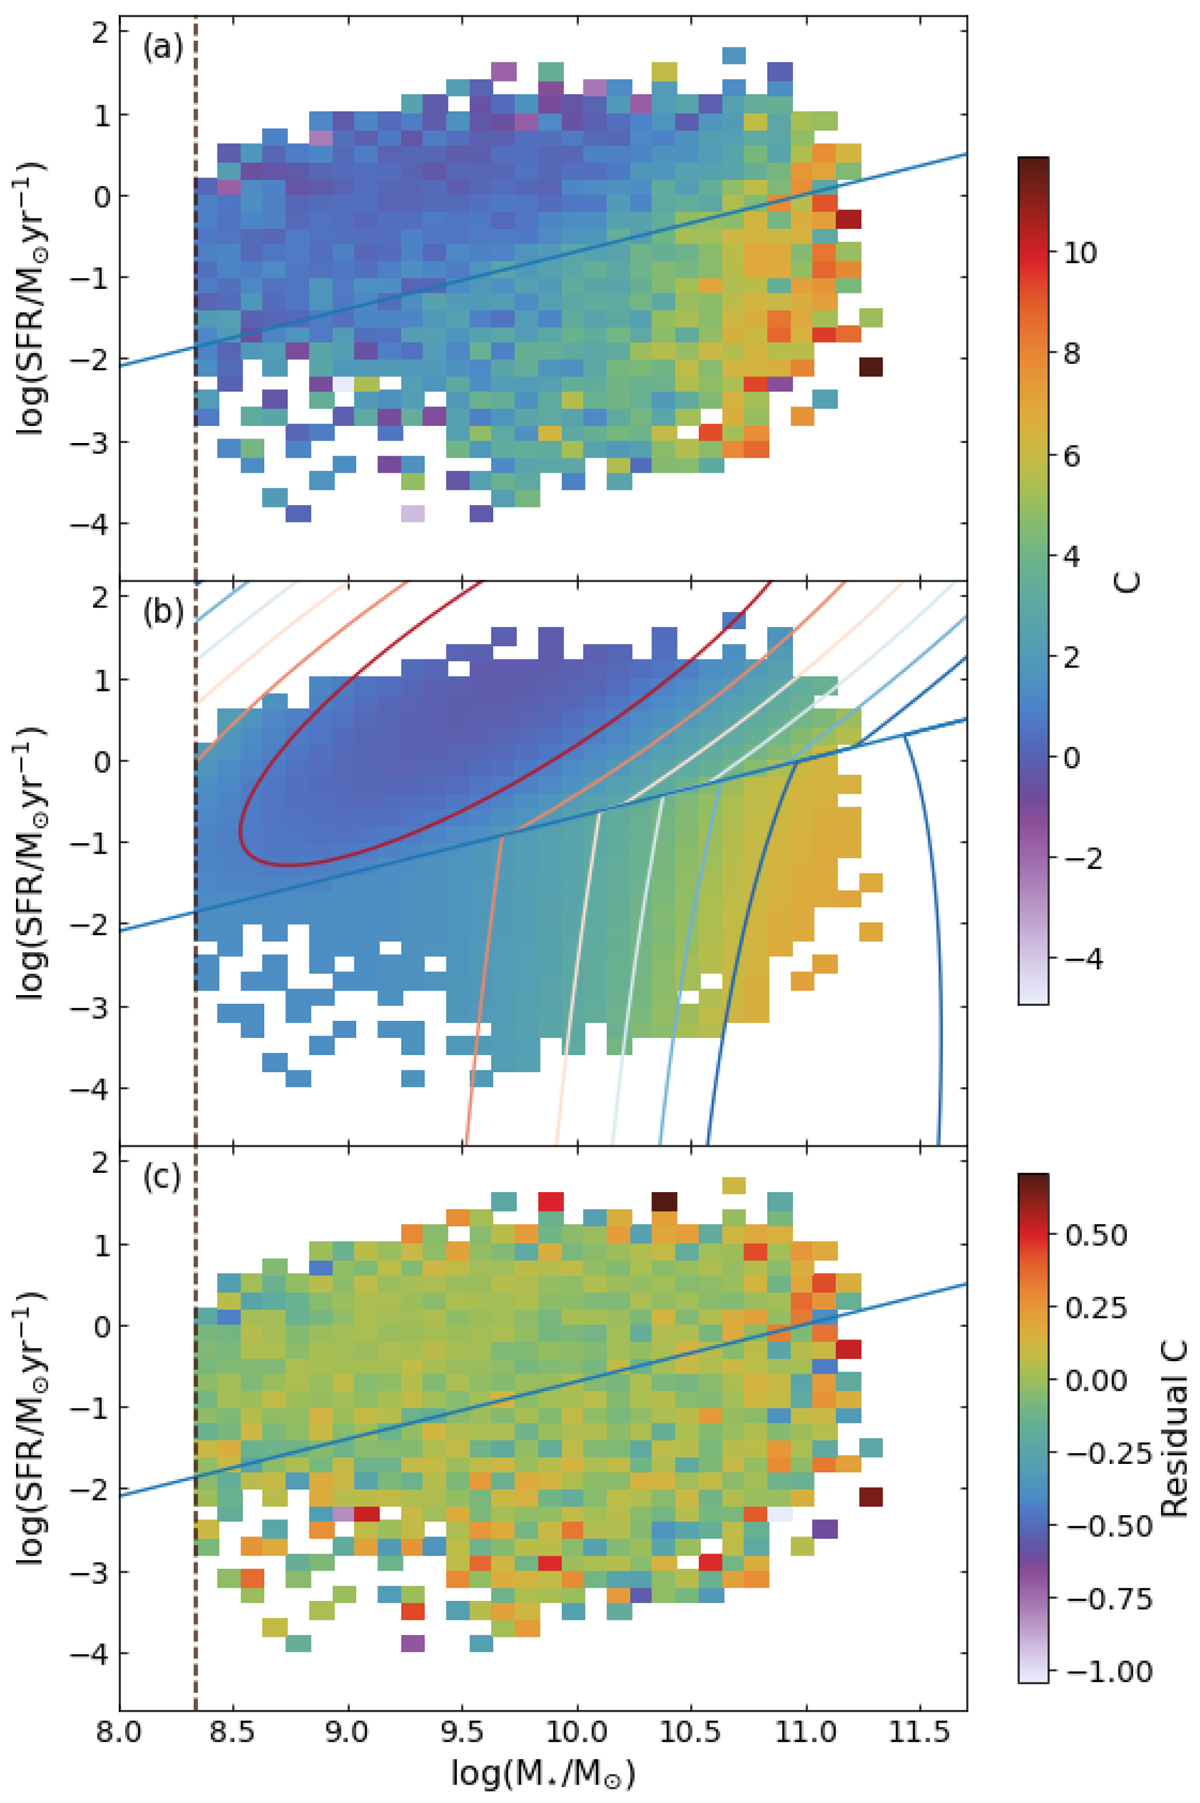
Example model fitting for the field galaxies’ concentration. A plot of SFR against M⋆ for the field galaxies, colour coded by the average concentration within each SFR-M⋆ bin. The bins containing at least 50 galaxies are shown. Panel a is the observed data, panel b is the model, and panel c is the residual from subtracting the model from the observations while the blue line indicates the split used for star-forming and quiescent galaxies (Eq. (2)) and the vertical dashed brown line indicates the mass limit. Panels a and b share a colour scale. Contours for the model are overlaid in panel b from low values (red) to high (blue).
Current usage metrics show cumulative count of Article Views (full-text article views including HTML views, PDF and ePub downloads, according to the available data) and Abstracts Views on Vision4Press platform.
Data correspond to usage on the plateform after 2015. The current usage metrics is available 48-96 hours after online publication and is updated daily on week days.
Initial download of the metrics may take a while.