Fig. 16.
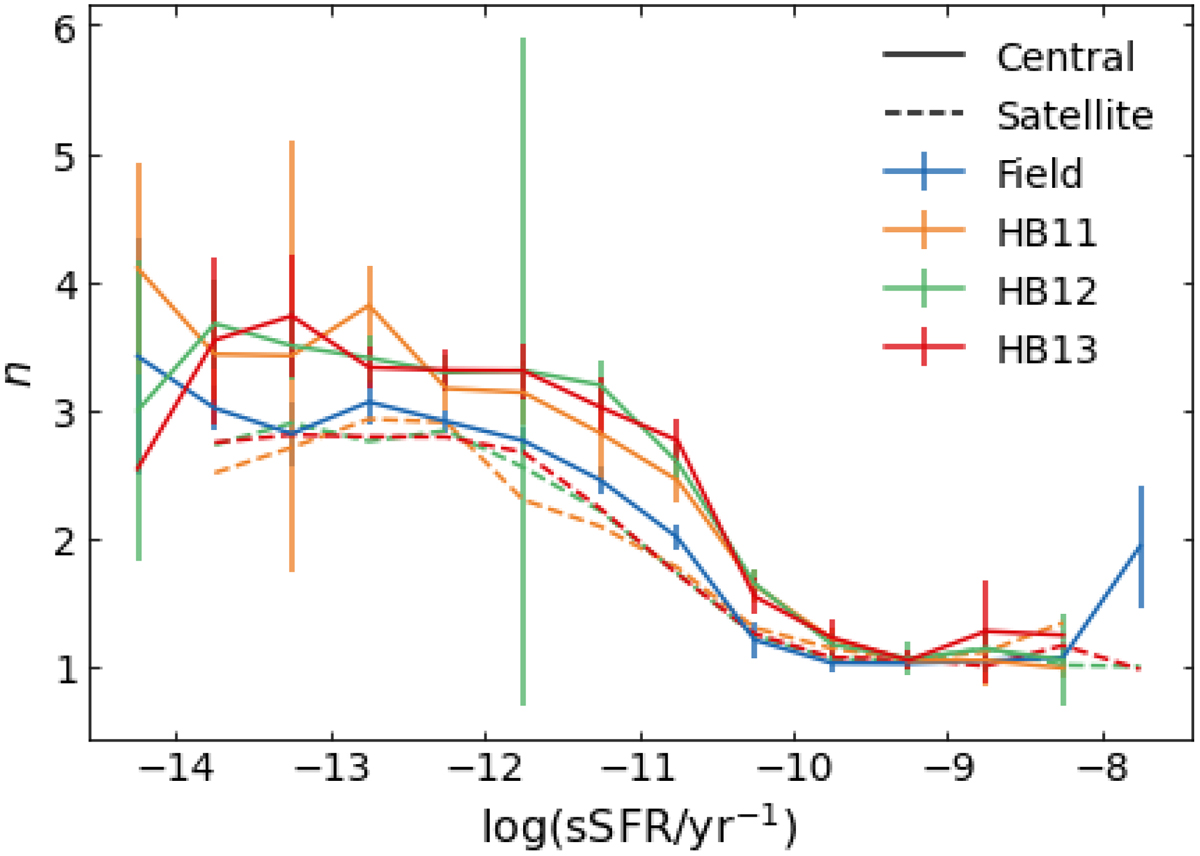
Median of n as a function of sSFR for the field galaxies (blue) and the central (solid) and satellite (dashed) HB11 (orange), HB12 (green), and HB13 (red) groups. The satellite galaxies closely follow the field galaxies while the central galaxies have higher n at low sSFR. Error bars for satellite galaxies are omitted for clarity of the plot but are comparable to the errors of the central galaxies.
Current usage metrics show cumulative count of Article Views (full-text article views including HTML views, PDF and ePub downloads, according to the available data) and Abstracts Views on Vision4Press platform.
Data correspond to usage on the plateform after 2015. The current usage metrics is available 48-96 hours after online publication and is updated daily on week days.
Initial download of the metrics may take a while.