Free Access
Fig. 1.
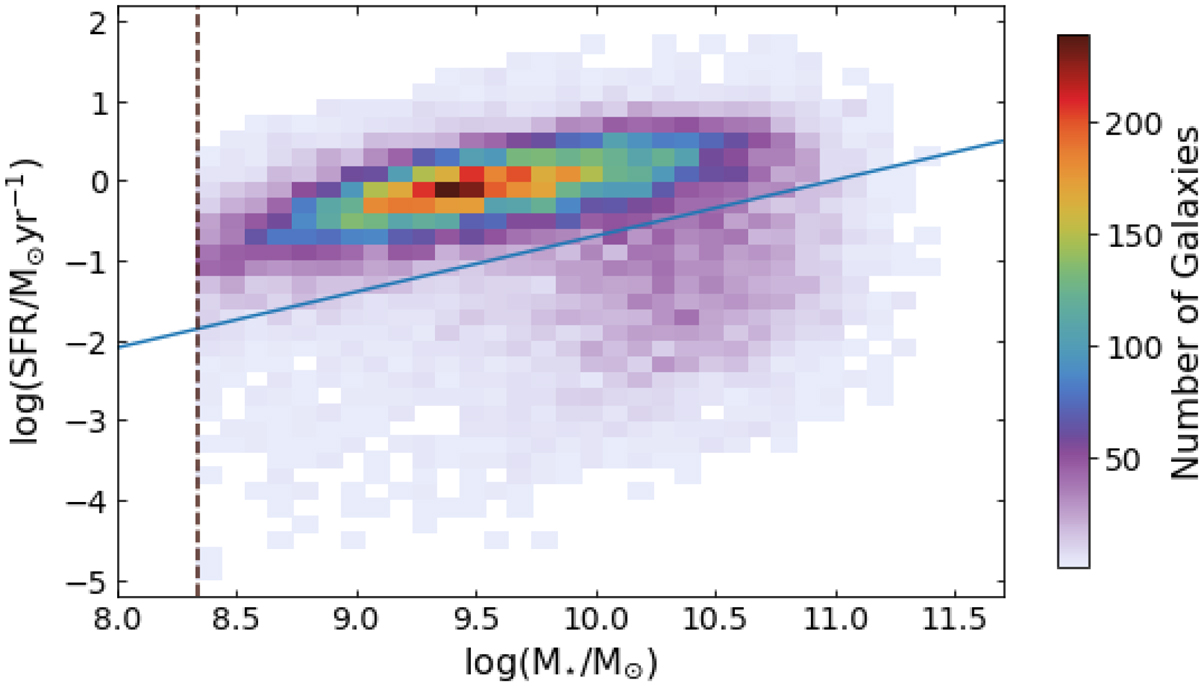
SFR against M⋆ for the field galaxies showing the number density from low (light purple) to high (red). The blue line indicates the visually defined cut between the star-forming and quiescent galaxies as defined by Eq. (2), while the vertical dashed brown line indicates the mass limit.
Current usage metrics show cumulative count of Article Views (full-text article views including HTML views, PDF and ePub downloads, according to the available data) and Abstracts Views on Vision4Press platform.
Data correspond to usage on the plateform after 2015. The current usage metrics is available 48-96 hours after online publication and is updated daily on week days.
Initial download of the metrics may take a while.