Fig. 2.
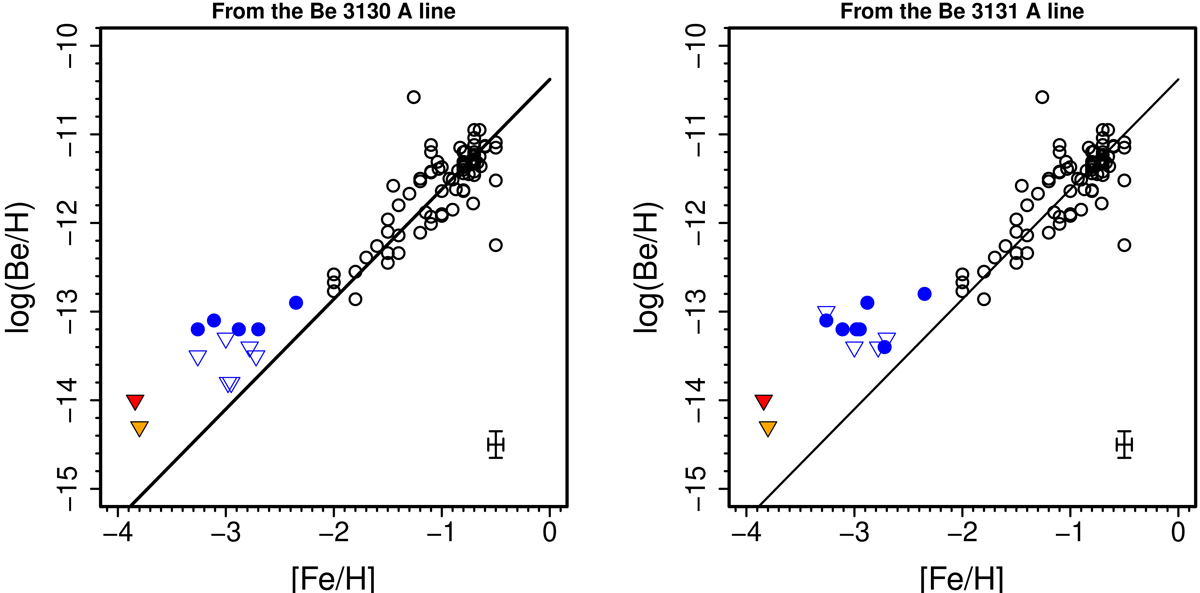
Beryllium abundances as a function of metallicity. Abundances resulting from this work are shown as blue circles and upper limits are shown as blue triangles. Stars from Smiljanic et al. (2009) are shown as open black circles. The solid line is a fit to those stars. The upper limits for stars 2MASS J18082002-5104378 (Spite et al. 2019) and BD+44 493 (Placco et al. 2014) are shown as upside-down red and orange triangles, respectively. Left and right panels: abundances and limits obtained from the 3130 and 3131 Å lines, respectively. A typical error bar of the new measurements is shown in the bottom right.
Current usage metrics show cumulative count of Article Views (full-text article views including HTML views, PDF and ePub downloads, according to the available data) and Abstracts Views on Vision4Press platform.
Data correspond to usage on the plateform after 2015. The current usage metrics is available 48-96 hours after online publication and is updated daily on week days.
Initial download of the metrics may take a while.