Fig. 1.
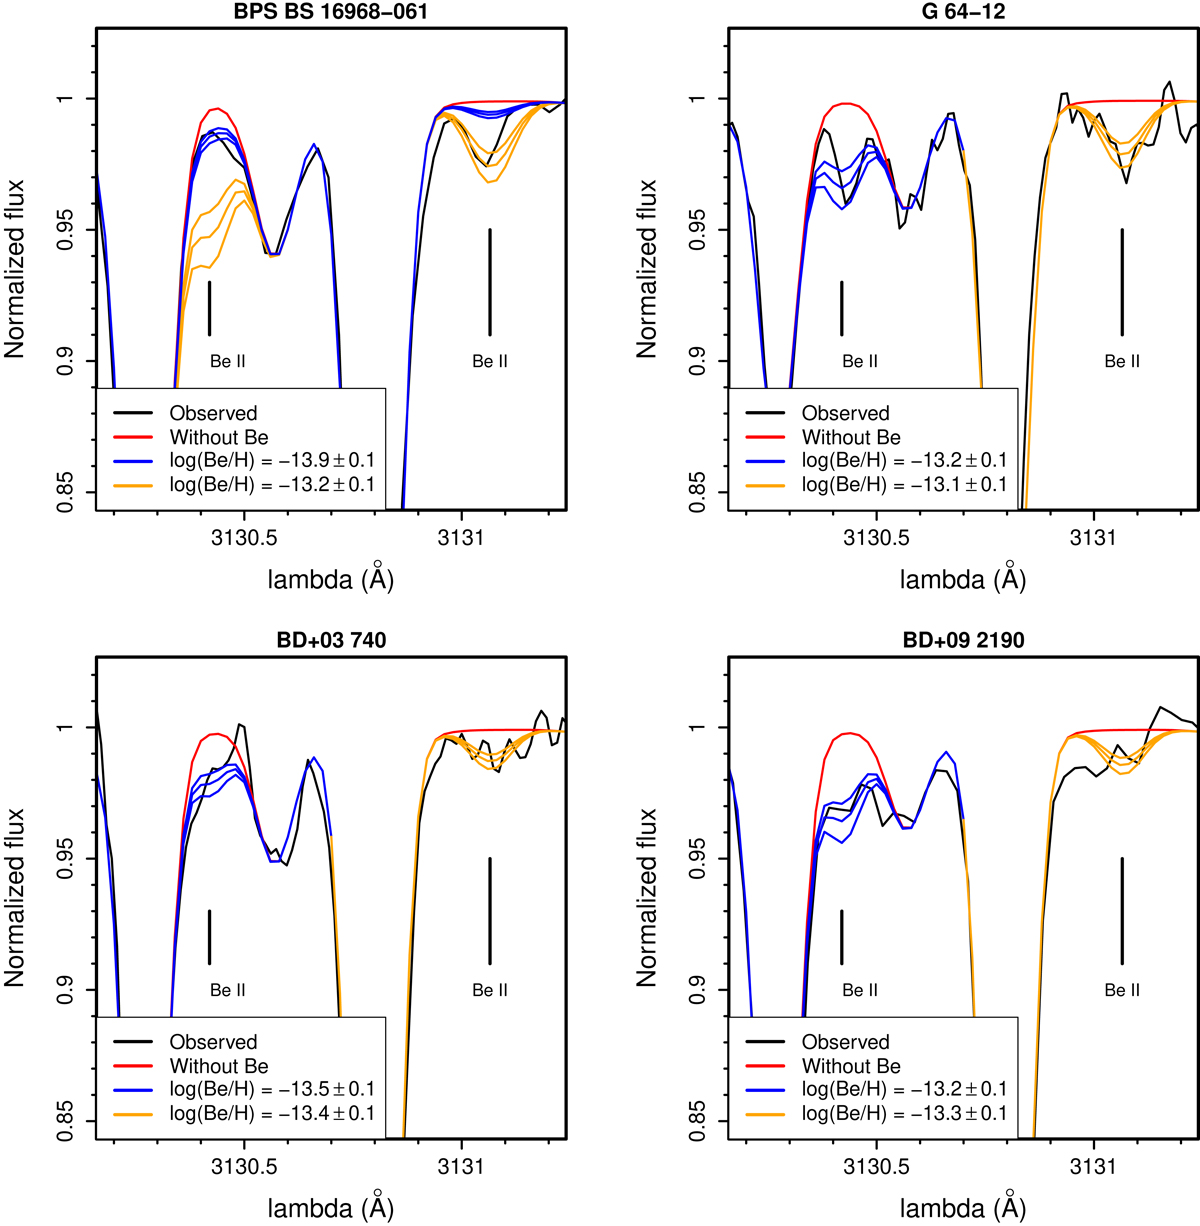
Synthetic fit to Be lines in stars BS 16968-061 (top left), G 64-12 (top right), BD+03 740 (bottom left), and BD+09 2190 (bottom right). Each of the Be lines was fit separately. The best fit is shown together with spectra where the Be abundance was changed by ±0.1 dex. To aid in the visualisation, when necessary, some spectra are only shown in half of the panel.
Current usage metrics show cumulative count of Article Views (full-text article views including HTML views, PDF and ePub downloads, according to the available data) and Abstracts Views on Vision4Press platform.
Data correspond to usage on the plateform after 2015. The current usage metrics is available 48-96 hours after online publication and is updated daily on week days.
Initial download of the metrics may take a while.