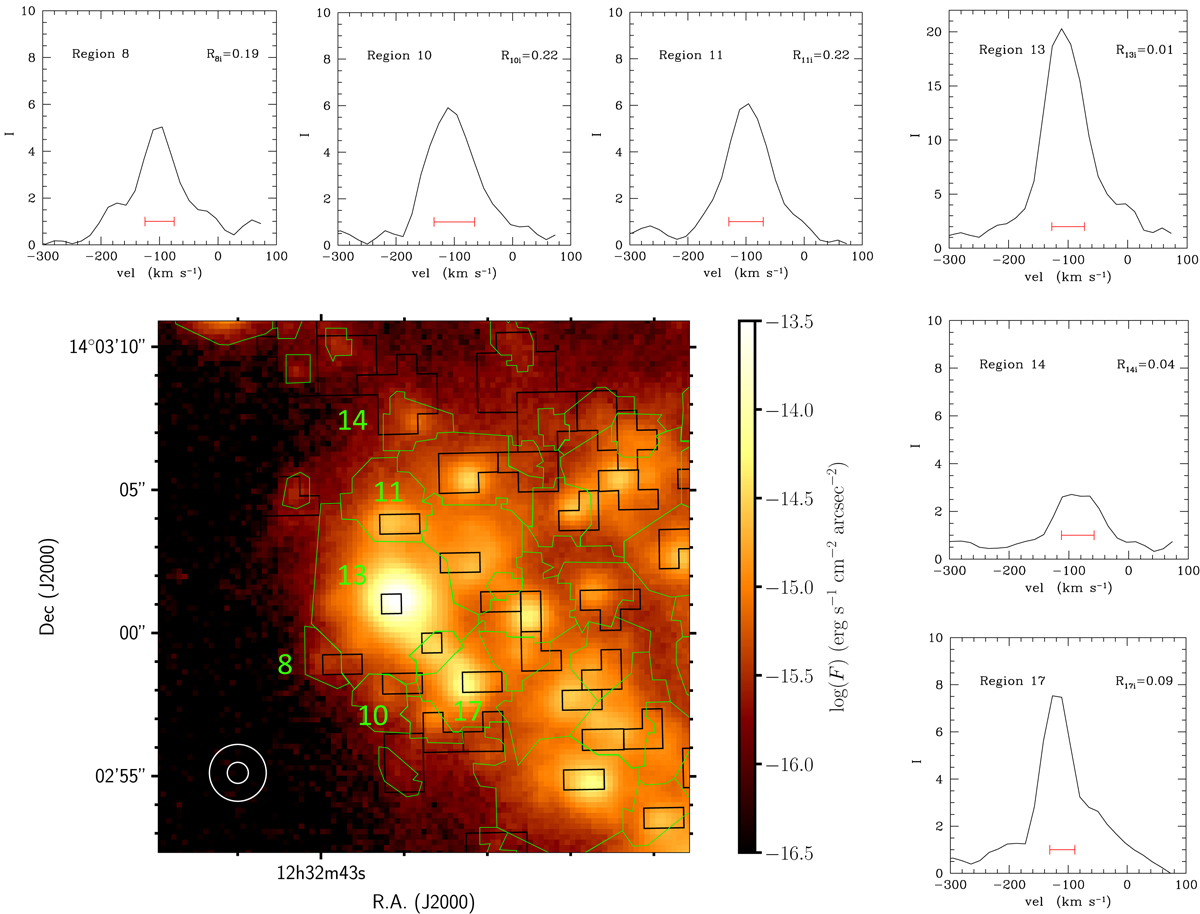
Fig. D.1.

Estimate of the kinematical parameters of HII regions in crowded regions. Lower left panel: narrow-band Hα image of a crowded region in IC 3476. The boundaries of the individual HII regions identified by the HIIPHOT pipeline are indicated with green contours. The corresponding Voronoi bins in the Fabry-Perot data are indicated with black polygons. The limiting seeing of the VESTIGE and of the Fabry-Perot data are denoted with two concentric circles on the lower left corner of the image. The upper and right-hand panels of the figure show the Hα line profiles of the velocity dispersion (in arbitrary units) of the six selected regions indicated in the lower left panel. Of these, regions 10 and 11 do not satisfy the R1i ≤ 0.2 criterion given above, and are thus excluded from the analysis of the kinematical properties of HII regions given in the text, while regions 8, 13, 14, and 17 are included. In each panel, the red horizontal line gives the measured ![]() , where σ is the velocity dispersion.
, where σ is the velocity dispersion.
Current usage metrics show cumulative count of Article Views (full-text article views including HTML views, PDF and ePub downloads, according to the available data) and Abstracts Views on Vision4Press platform.
Data correspond to usage on the plateform after 2015. The current usage metrics is available 48-96 hours after online publication and is updated daily on week days.
Initial download of the metrics may take a while.


