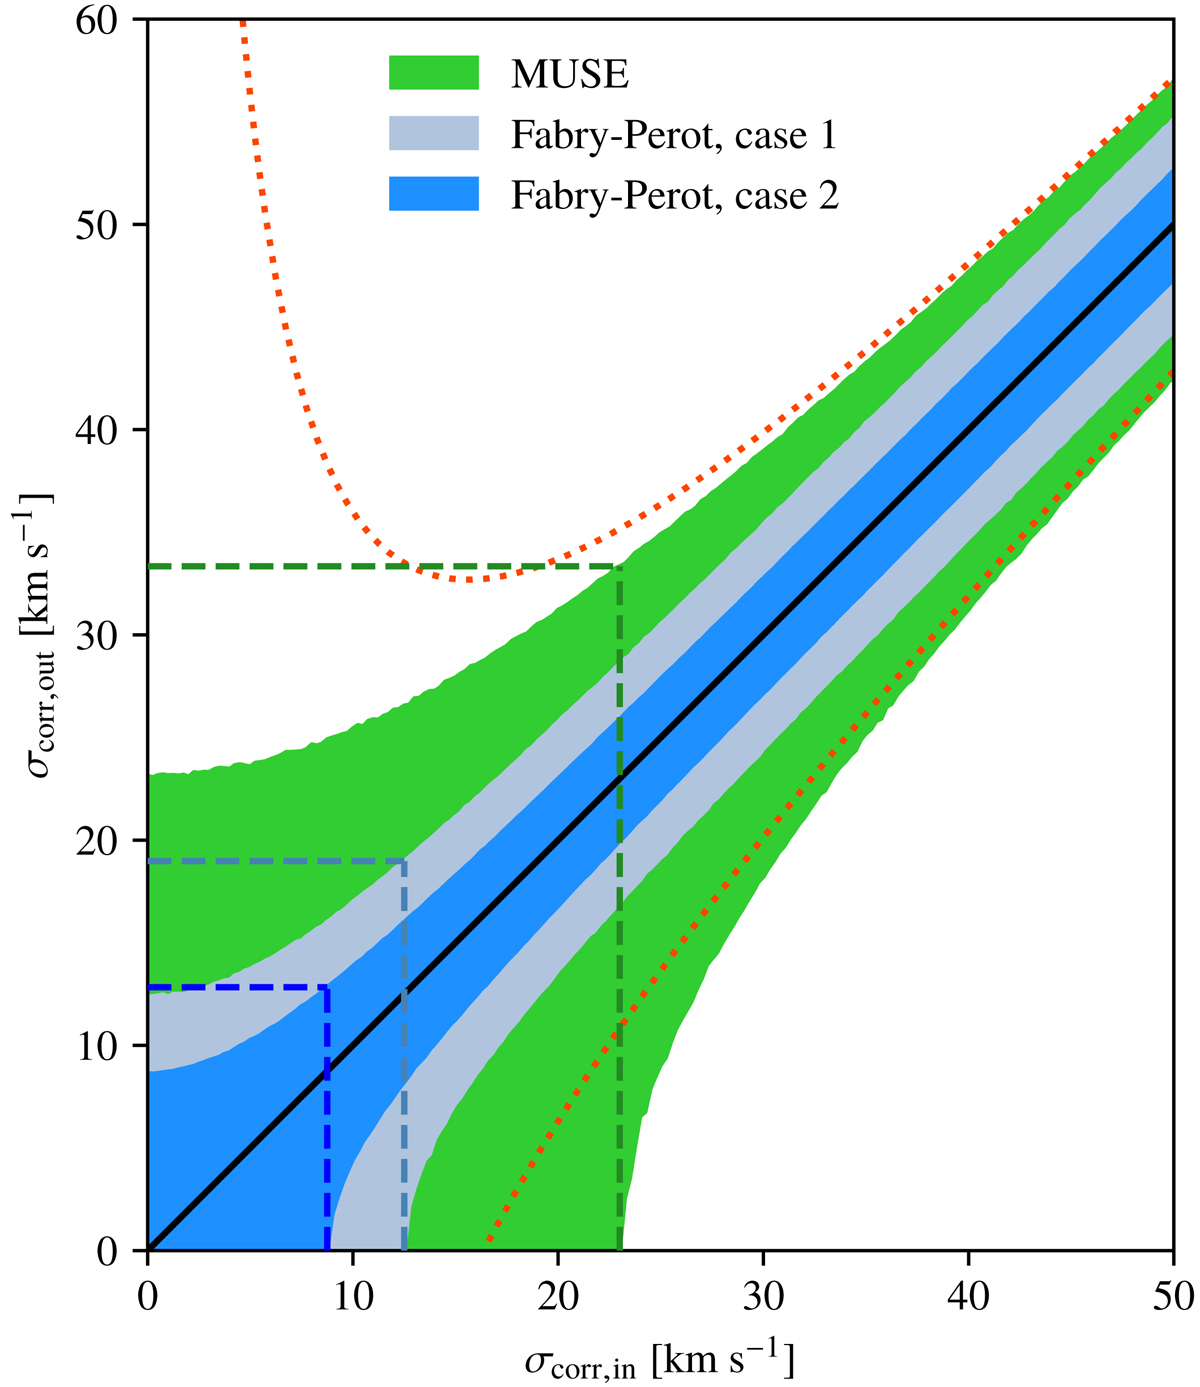
Fig. A.1.

Range of recovered corrected velocity dispersions σcorr, out as a function of the input corrected velocity dispersion σcorr, in for several set-ups. The red dotted line corresponds to the analytical propagation of uncertainty of the MUSE set-up, where σLSF = 50 km s−1, δσobs = 5 km s−1, and δσLSF = 1 km s−1. The interval determined from the Monte Carlo approach for this set-up is shown as the green area, which is partially hidden by the blue areas for visual convenience. The blue areas correspond to the Fabry-Perot set-ups, where σLSF = 13 km s−1 and δσLSF = 1 km s−1. The light blue area, which is again partially hidden by the dark blue area, corresponds to the MUSE-like uncertainties (case 1), where δσobs = 5 km s−1, whereas the darker blue area corresponds to the most realistic hypothesis (case 2), where δσobs = 2.5 km s−1. The black line shows the one-to-one relation. The three dashed lines (green, light, and dark blue) correspond to the three set-ups. The vertical lines show the corrected velocity dispersion in which the lower limit gets larger than zero. The horizontal lines show the corresponding upper limit, which defines the range of reliable corrected velocity dispersion.
Current usage metrics show cumulative count of Article Views (full-text article views including HTML views, PDF and ePub downloads, according to the available data) and Abstracts Views on Vision4Press platform.
Data correspond to usage on the plateform after 2015. The current usage metrics is available 48-96 hours after online publication and is updated daily on week days.
Initial download of the metrics may take a while.


