Free Access
Fig. 3
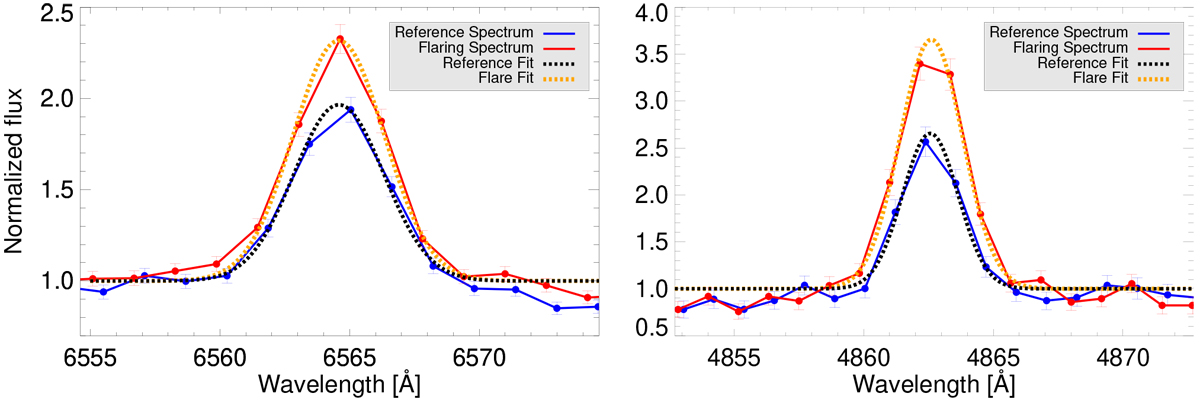
Example of a flaring Hα line (left panel) and flaring Hβ line (right panel) detected on a M 5e star. Two single spectra are shown, one as a reference and one as an example of a flare. The data points with error bars together with the Gaussian fits are shown.
Current usage metrics show cumulative count of Article Views (full-text article views including HTML views, PDF and ePub downloads, according to the available data) and Abstracts Views on Vision4Press platform.
Data correspond to usage on the plateform after 2015. The current usage metrics is available 48-96 hours after online publication and is updated daily on week days.
Initial download of the metrics may take a while.