Fig. 7.
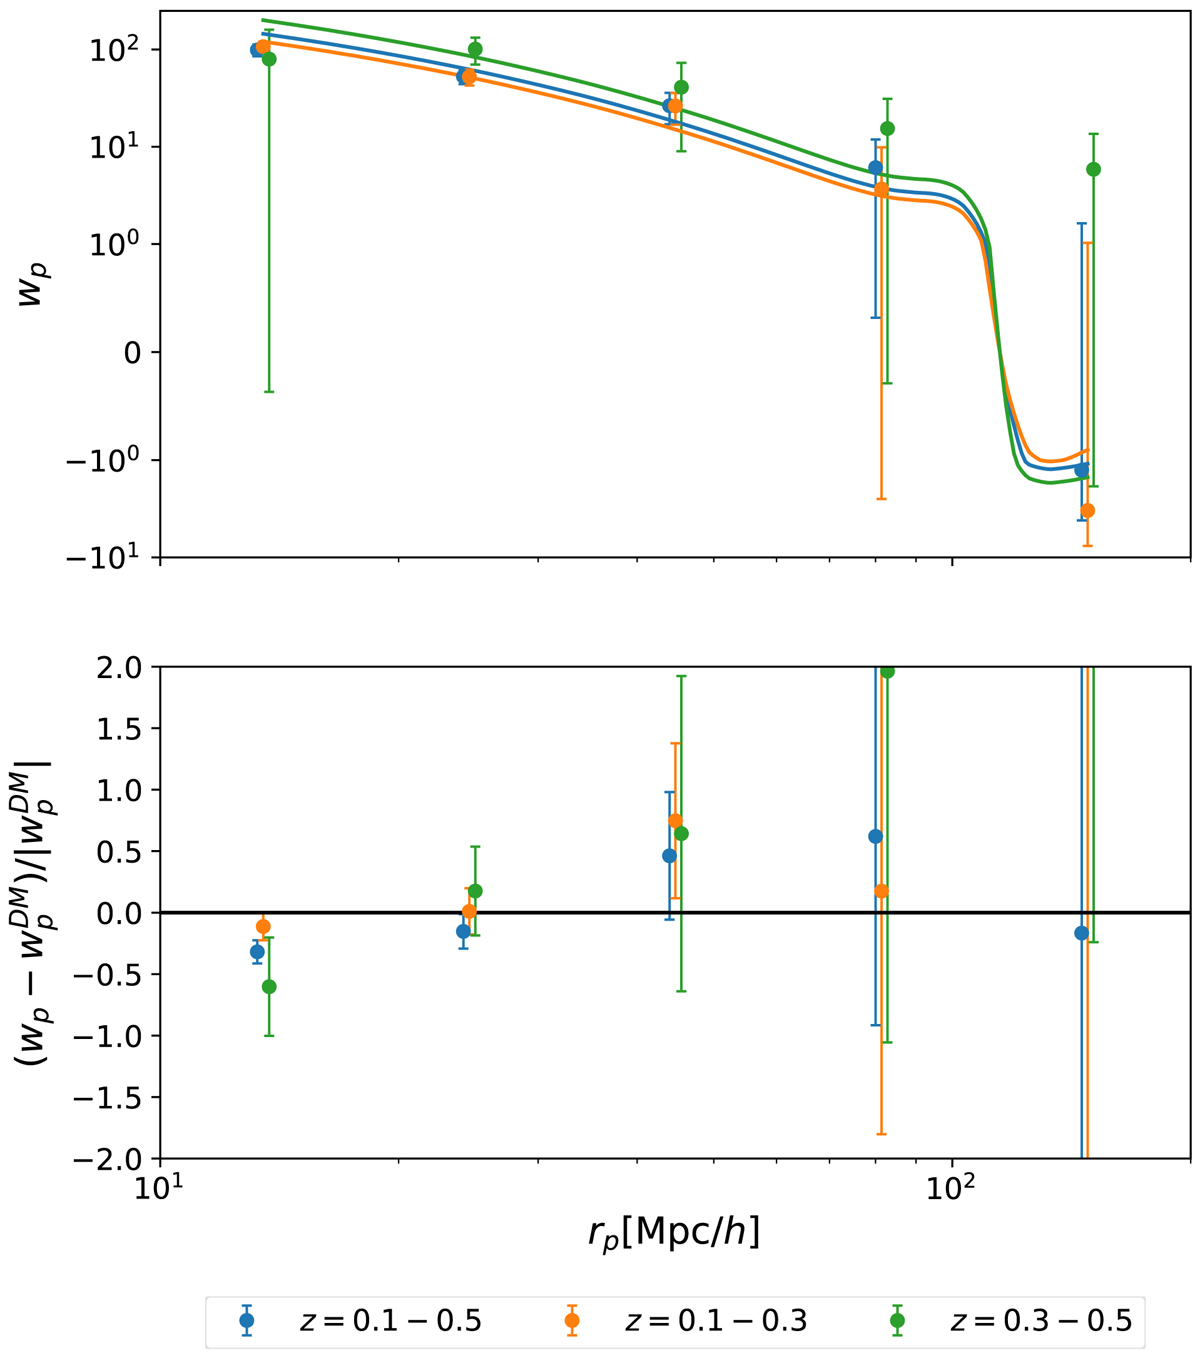
Comparison of different redshift ranges. Top panel: projected two-point correlation function in three redshift ranges 0.1 < z < 0.5, 0.1 < z < 0.3 and 0.3 < z < 0.5. Data points are the two-point correlation function estimates from the CODEX clusters. The solid curves in corresponding colors show the predicted dark matter two-point correlation function scaled by ![]() computed within each cluster subsample. Bottom panel: relative difference between the two-point correlation function estimate and the corresponding prediction. The data points have been shifted horizontally for clarity.
computed within each cluster subsample. Bottom panel: relative difference between the two-point correlation function estimate and the corresponding prediction. The data points have been shifted horizontally for clarity.
Current usage metrics show cumulative count of Article Views (full-text article views including HTML views, PDF and ePub downloads, according to the available data) and Abstracts Views on Vision4Press platform.
Data correspond to usage on the plateform after 2015. The current usage metrics is available 48-96 hours after online publication and is updated daily on week days.
Initial download of the metrics may take a while.