Fig. 3.
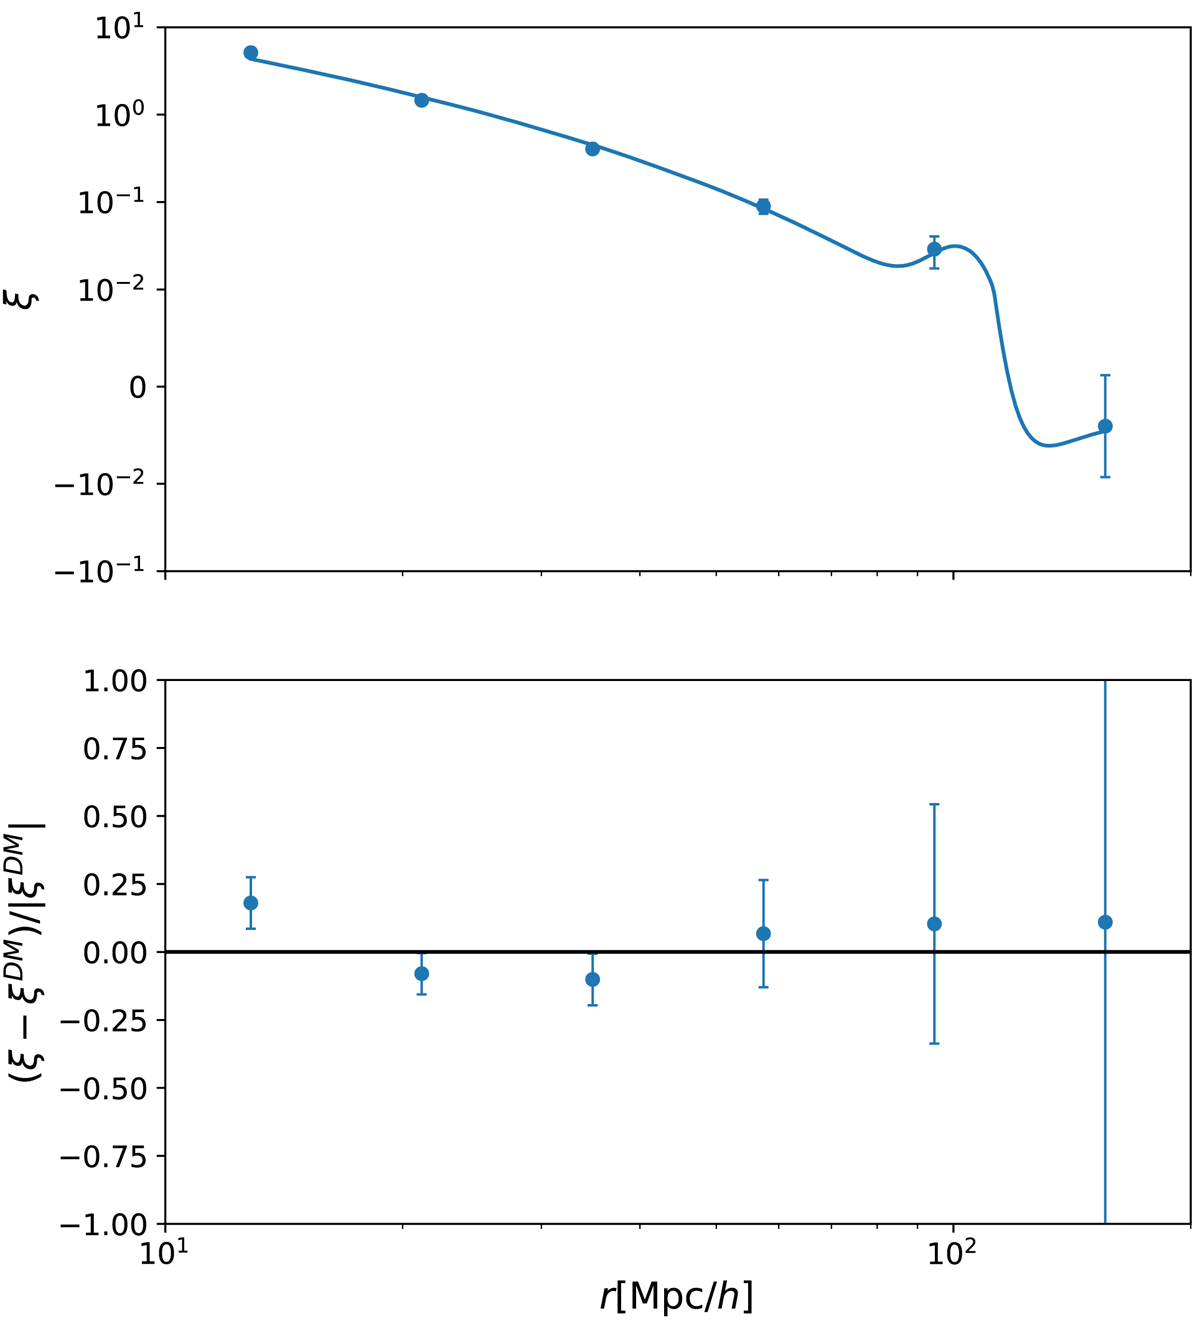
One-dimensional two-point correlation function from HMDPL halos. Top panel: data points are the two-point correlation function estimate from the halo distribution. The solid curve is the predicted dark matter two-point correlation function scaled by ![]() . Bottom panel: relative difference between the measured and predicted two-point correlation functions.
. Bottom panel: relative difference between the measured and predicted two-point correlation functions.
Current usage metrics show cumulative count of Article Views (full-text article views including HTML views, PDF and ePub downloads, according to the available data) and Abstracts Views on Vision4Press platform.
Data correspond to usage on the plateform after 2015. The current usage metrics is available 48-96 hours after online publication and is updated daily on week days.
Initial download of the metrics may take a while.