Fig. 13.
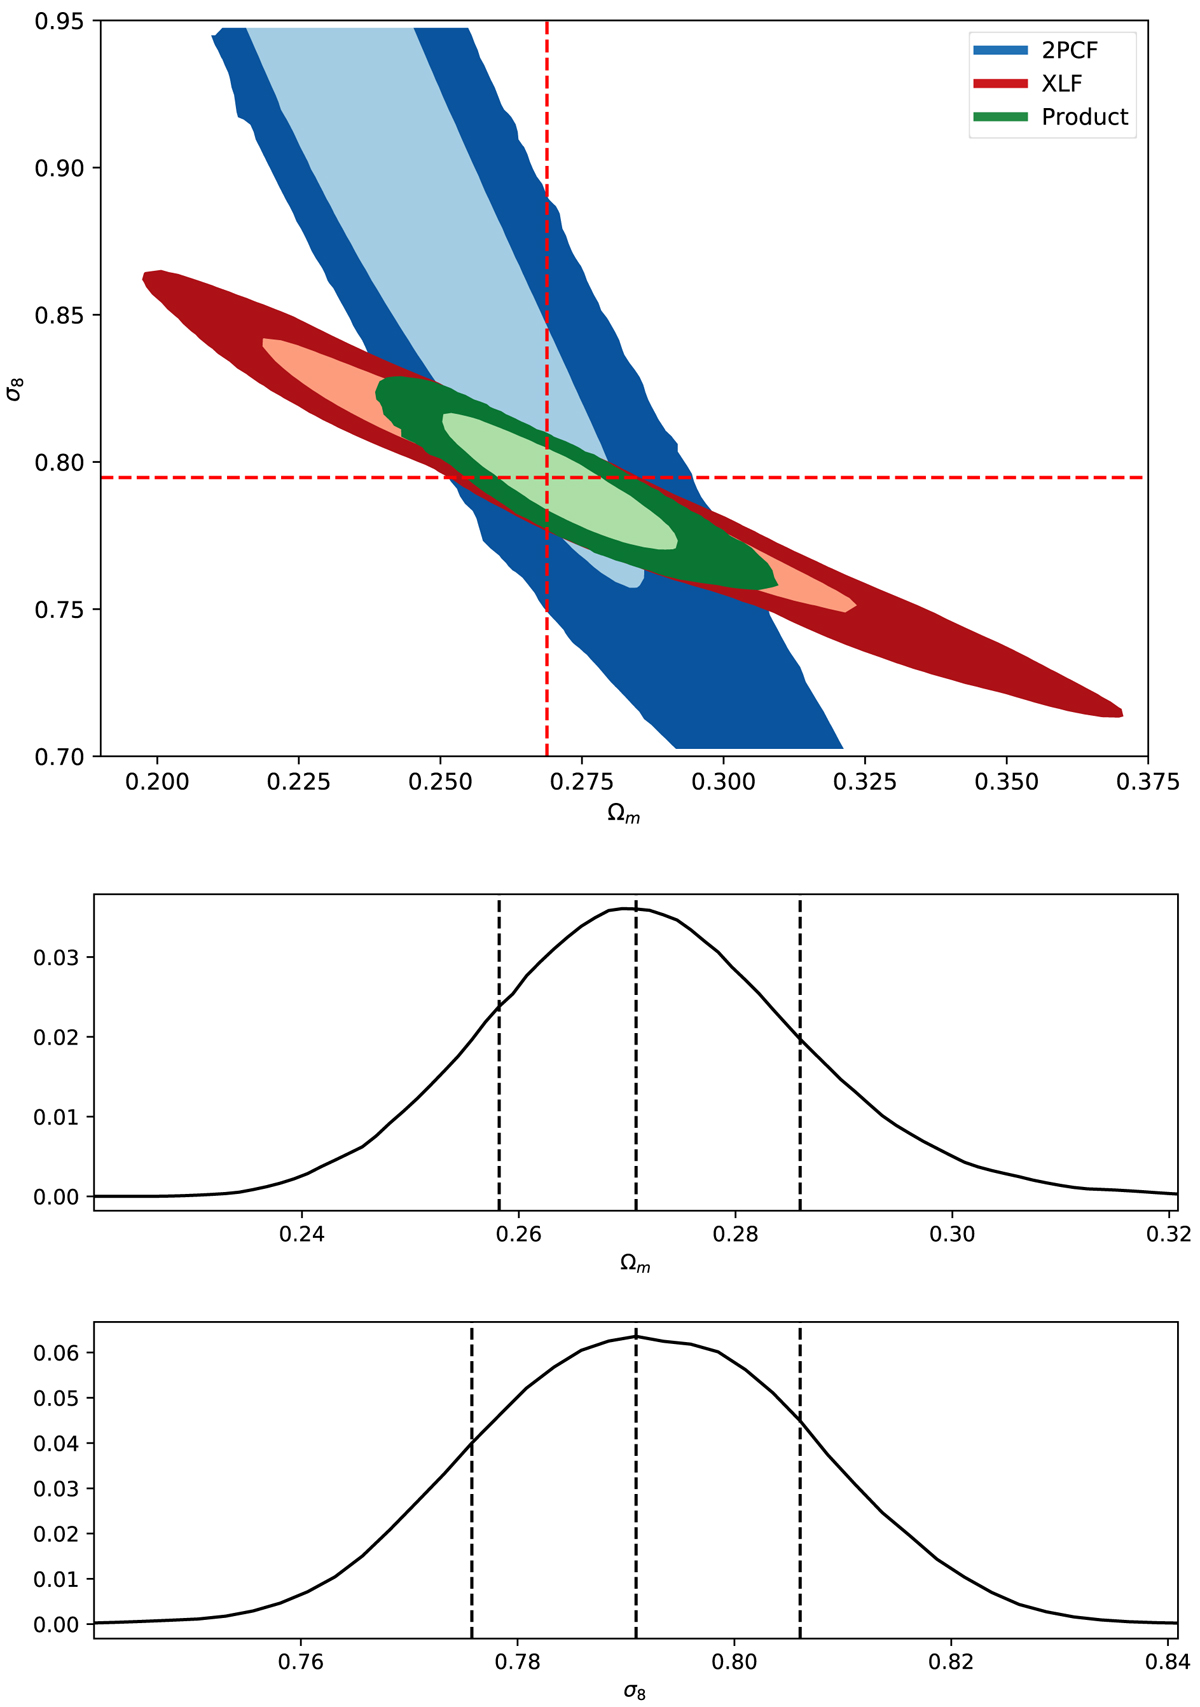
Parameter constraints combining two-point correlation function and luminosity function likelihoods. Top panel: likelihood function of (Ωm0, σ8) from the cluster two-point correlation function (blue), X-ray luminosity function (red), and joint distribution (green). The light and dark contours are the 68% and 95% confidence regions, respectively, and the dashed red lines show the best-fit values for the joint likelihood. Bottom panel: marginalized posterior distributions for Ωm0 and σ8 obtained from the joint likelihood in the top panel. The dashed black lines show the 16%, 50%, and 84% quantiles.
Current usage metrics show cumulative count of Article Views (full-text article views including HTML views, PDF and ePub downloads, according to the available data) and Abstracts Views on Vision4Press platform.
Data correspond to usage on the plateform after 2015. The current usage metrics is available 48-96 hours after online publication and is updated daily on week days.
Initial download of the metrics may take a while.