Fig. 12.
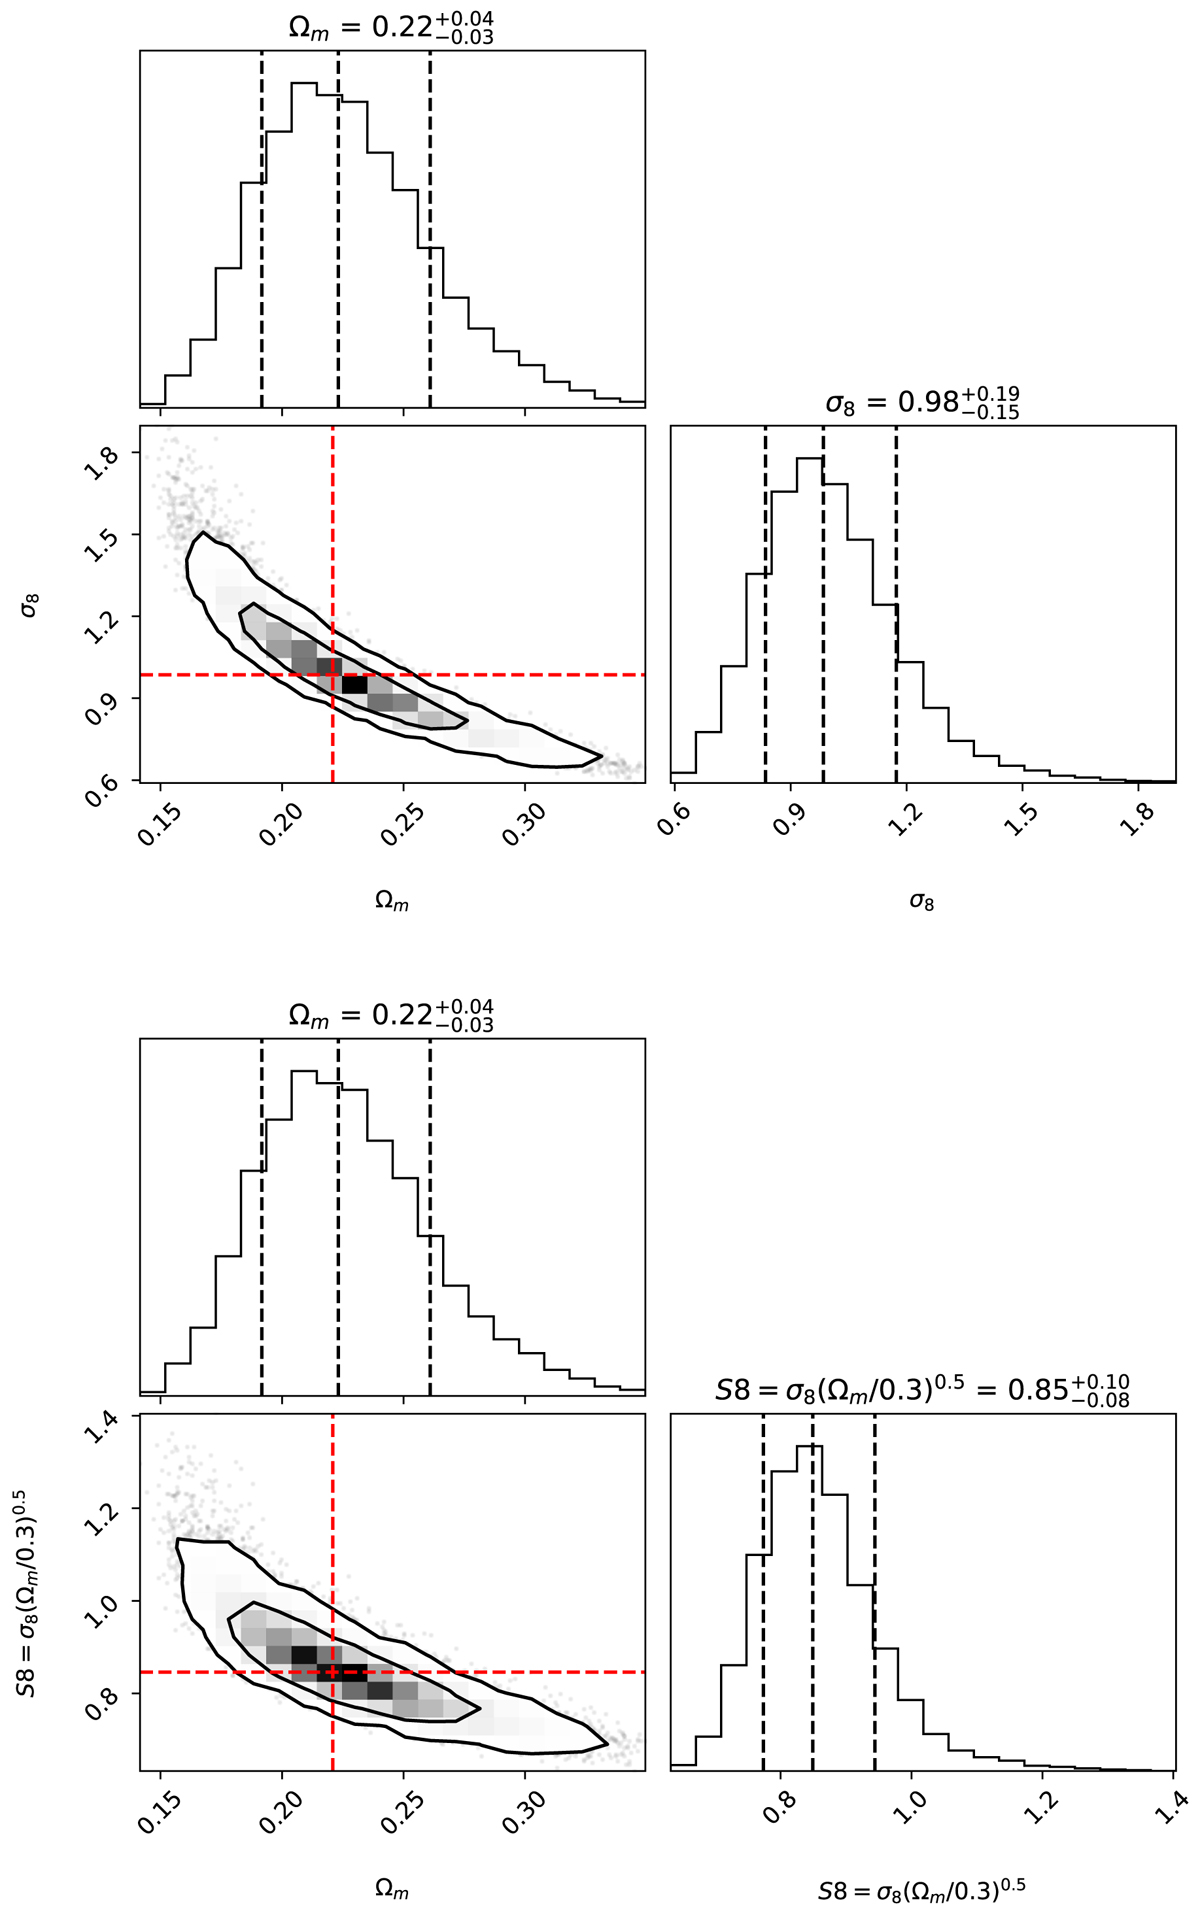
Posterior distribution for the parameters Ωm0, σ8, and S8 for the CODEX catalog split into two redshift bins 0.1 < z < 0.3 and 0.3 < z < 0.5. The contours show the 68% and 95% confidence regions, and the best fit values are shown by the dashed red lines. The dashed black lines in the marginalized posteriors show the 16%, 50%, and 84% quantiles.
Current usage metrics show cumulative count of Article Views (full-text article views including HTML views, PDF and ePub downloads, according to the available data) and Abstracts Views on Vision4Press platform.
Data correspond to usage on the plateform after 2015. The current usage metrics is available 48-96 hours after online publication and is updated daily on week days.
Initial download of the metrics may take a while.