Fig. 9.
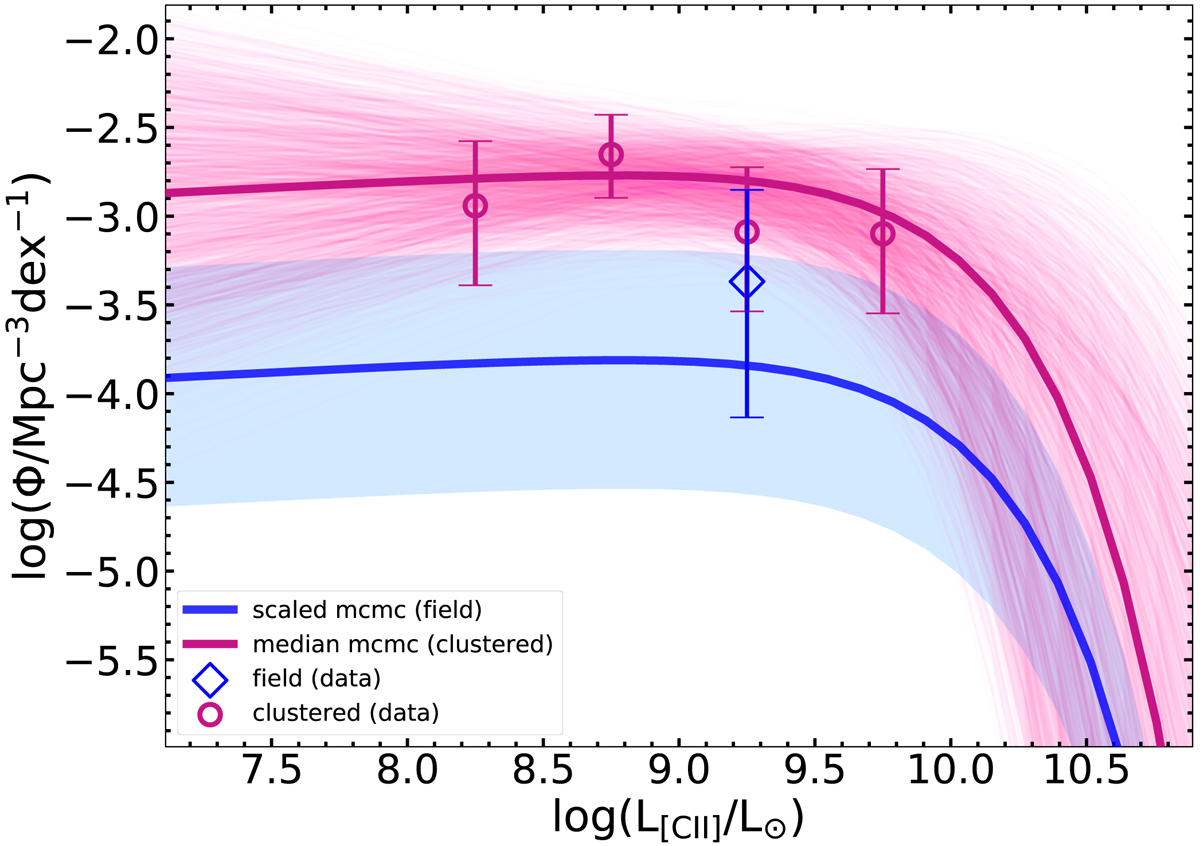
Schechter functions for the clustered (pink) and field (azure) [C II] LFs. Also, the observed LFs corresponding to the independent luminosity bins are indicated (same color code). We fitted log Φ*, log L*, and α for the clustered LF using a Markov chain Monte Carlo (MCMC) method. We assumed for the field sample the same α and log L* of the clustered LF and we scaled the normalization of the clustered LF by a factor of 11 (corresponding to the ratio between the number of clustered and field sources). The shaded area (pink; clustered sample) shows the MCMC realizations within the 16th and 84th percentile, hence, it corresponds approximately to 1σ errorbars. In case of the scaled field LF, the 1σ errors (blue area) were computed from the uncertainties of log Φ* of the clustered sample and the Poissonian uncertainty (at 1σ) on 11 counts.
Current usage metrics show cumulative count of Article Views (full-text article views including HTML views, PDF and ePub downloads, according to the available data) and Abstracts Views on Vision4Press platform.
Data correspond to usage on the plateform after 2015. The current usage metrics is available 48-96 hours after online publication and is updated daily on week days.
Initial download of the metrics may take a while.