Fig. 7.
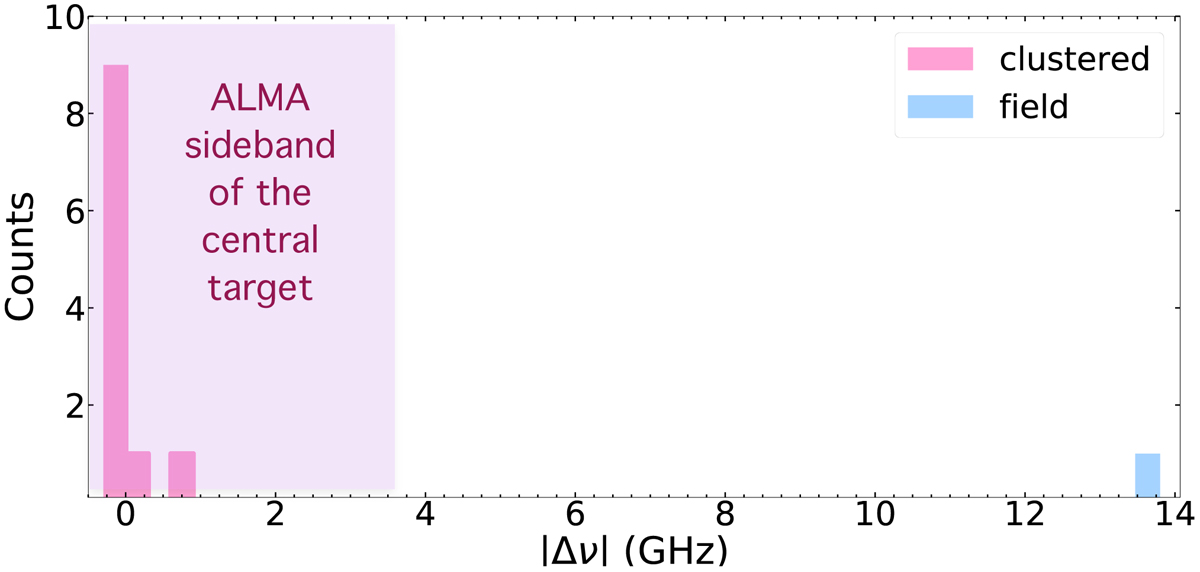
Offset in frequency between the central UV target and the serendipitous [C II] in the same pointing. We see that the distribution is non-uniform, with several sources lying at a frequency (and hence a redshift) close to that of the central target. We thus defined two subsamples (named “clustered” and “field”, respectively) and evaluated two distinct LFs in order to account for any bias due to overdense regions. The separation between the two sample relies on the frequency width of one ALMA sideband (3.6 GHz), corresponding to a velocity separation ≷2000 km s−1.
Current usage metrics show cumulative count of Article Views (full-text article views including HTML views, PDF and ePub downloads, according to the available data) and Abstracts Views on Vision4Press platform.
Data correspond to usage on the plateform after 2015. The current usage metrics is available 48-96 hours after online publication and is updated daily on week days.
Initial download of the metrics may take a while.