Fig. 6.
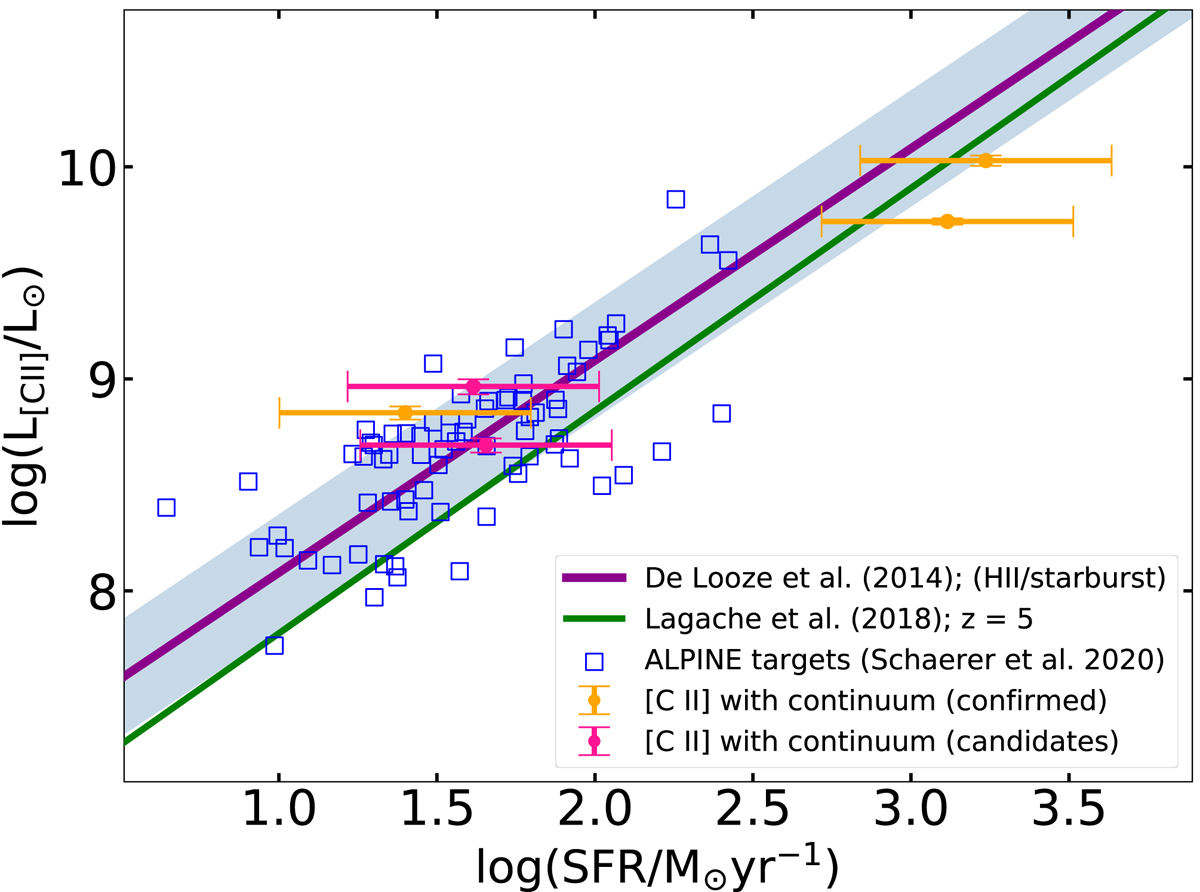
SFR–L[C II] relation for the five serendipitous lines detected in continuum. The SFR of the serendipitous sources was computed from the IR luminosity. We can see that the sample is quite consistent at 1σ (colored area) with the De Looze et al. (2014) relation (purple line), suggesting that the contribution from the UV–traced SFR is negligible. We compare our results also with the models of Lagache et al. (2018) at z = 5 that suggest a slightly different slope. We also show the ALPINE UV–targets from Schaerer et al. (2020). Both the serendipitous sources and the ALPINE targets seems to suggest no evolution of the relation of De Looze et al. (2014).
Current usage metrics show cumulative count of Article Views (full-text article views including HTML views, PDF and ePub downloads, according to the available data) and Abstracts Views on Vision4Press platform.
Data correspond to usage on the plateform after 2015. The current usage metrics is available 48-96 hours after online publication and is updated daily on week days.
Initial download of the metrics may take a while.