Fig. 5.
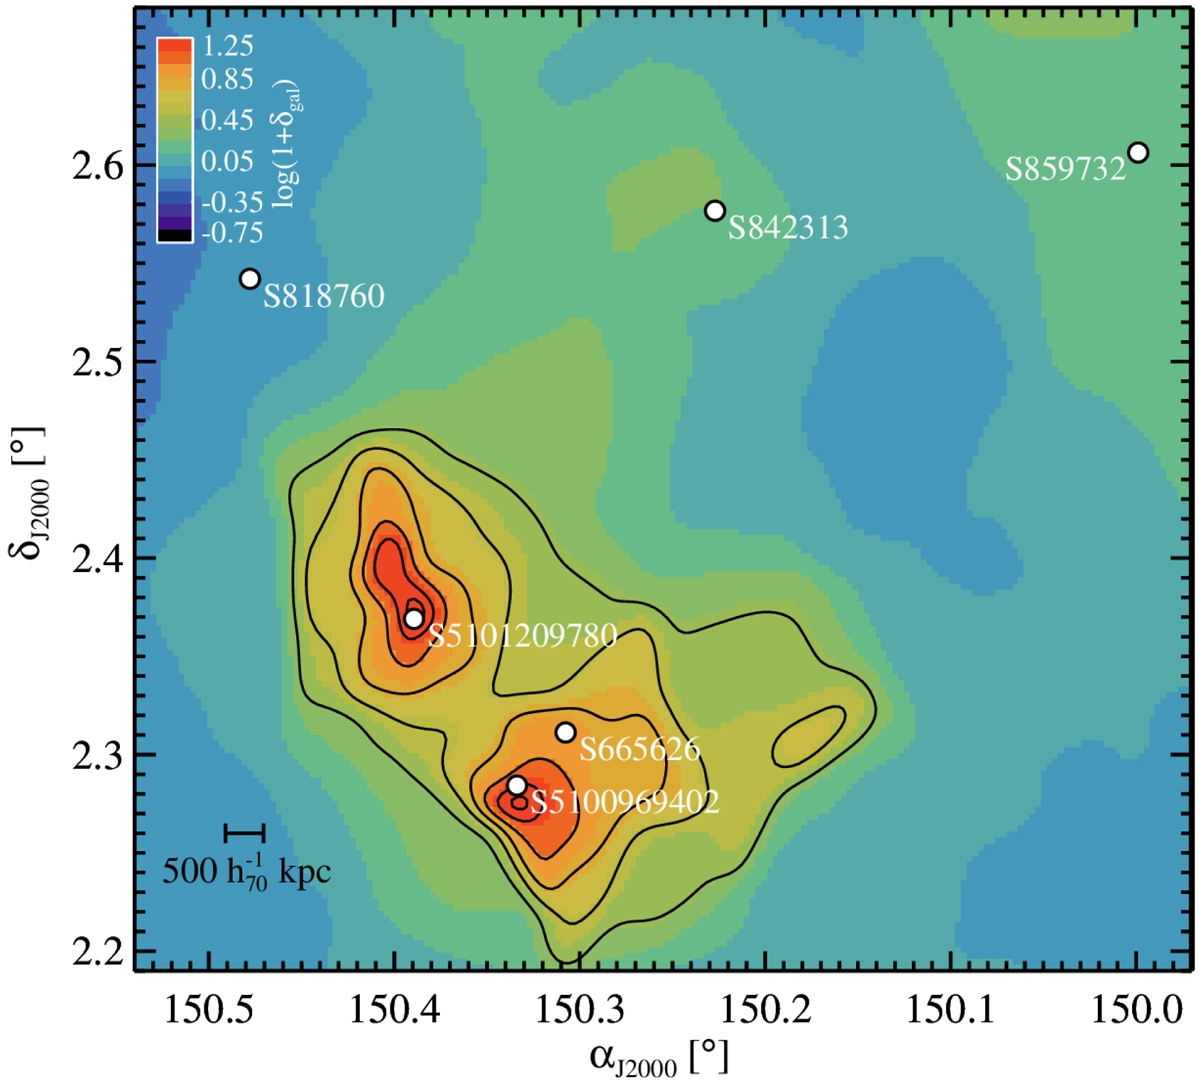
Galaxy overdensity map of the PCI J1001+0220 protocluster at z ∼ 4.5 (Lemaux et al. 2018). The contour levels correspond to 2.5, 3.75, 5, 6.25, 7.5, 8.5σ. We see that three serendipitous sources (S665626, S5101209780, and S5100969402) are clearly associated to the protocluster, as their location is very close to two density peaks. On the other hand, S842313, S818760, and S859732 lie in the periphery of the overdense region of PCI J1001+0220. The spectroscopic data used to construct this map combines VUDS, zCOSMOS, and followup Keck/Deep Imaging Multi–Object Spectrograph (DEIMOS; Faber et al. 2003) observations. These spectroscopic data are used in conjunction with COSMOS–2015 photometric redshifts (Laigle et al. 2016) to generate the galaxy density map following Monte Carlo Voronoi tesselation technique (see Cucciati et al. 2018; Ginolfi et al. 2020a; Lemaux et al. 2020 for details on the method and data).
Current usage metrics show cumulative count of Article Views (full-text article views including HTML views, PDF and ePub downloads, according to the available data) and Abstracts Views on Vision4Press platform.
Data correspond to usage on the plateform after 2015. The current usage metrics is available 48-96 hours after online publication and is updated daily on week days.
Initial download of the metrics may take a while.