Fig. 4.
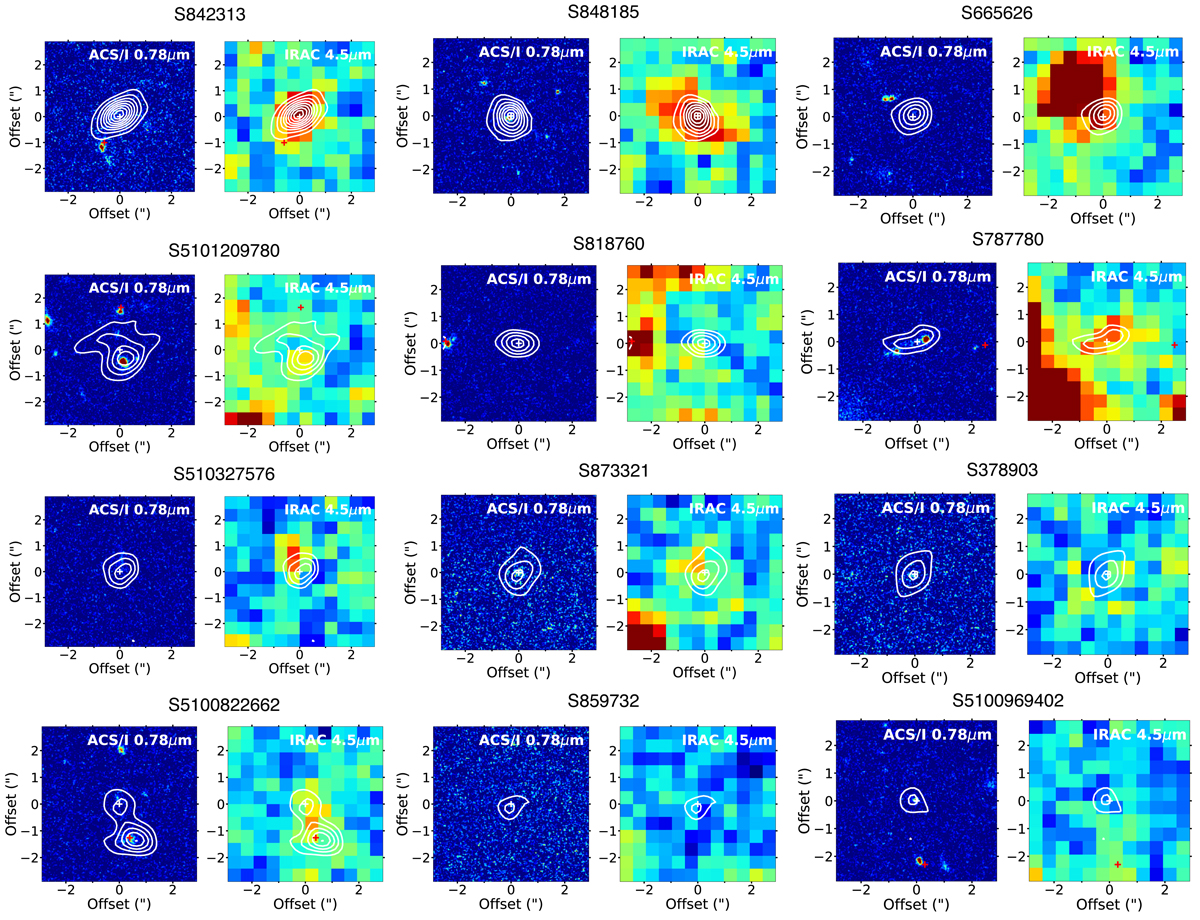
Images cutouts of the 12 serendipitous lines used to build the [C II] LF. The HST-ACS 0.78 μm (Koekemoer et al. 2007, 2011) and Spitzer–IRAC 4.5 μm (Capak et al. 2012) are reported. The white contour shows the [C II] emission in steps of 2σ (lowest level at 3σ). We indicate with a white cross the location of the serendipitous detection while the red cross shows the position of the central target. We can see that for 6 out of 12 lines the distance between the central target and the serendipitous line is < 3″, hence, there is a possibility that we are witnessing interacting systems. For S5100822662, the [C II] emission is blended with that of the central target.
Current usage metrics show cumulative count of Article Views (full-text article views including HTML views, PDF and ePub downloads, according to the available data) and Abstracts Views on Vision4Press platform.
Data correspond to usage on the plateform after 2015. The current usage metrics is available 48-96 hours after online publication and is updated daily on week days.
Initial download of the metrics may take a while.