Fig. 3.
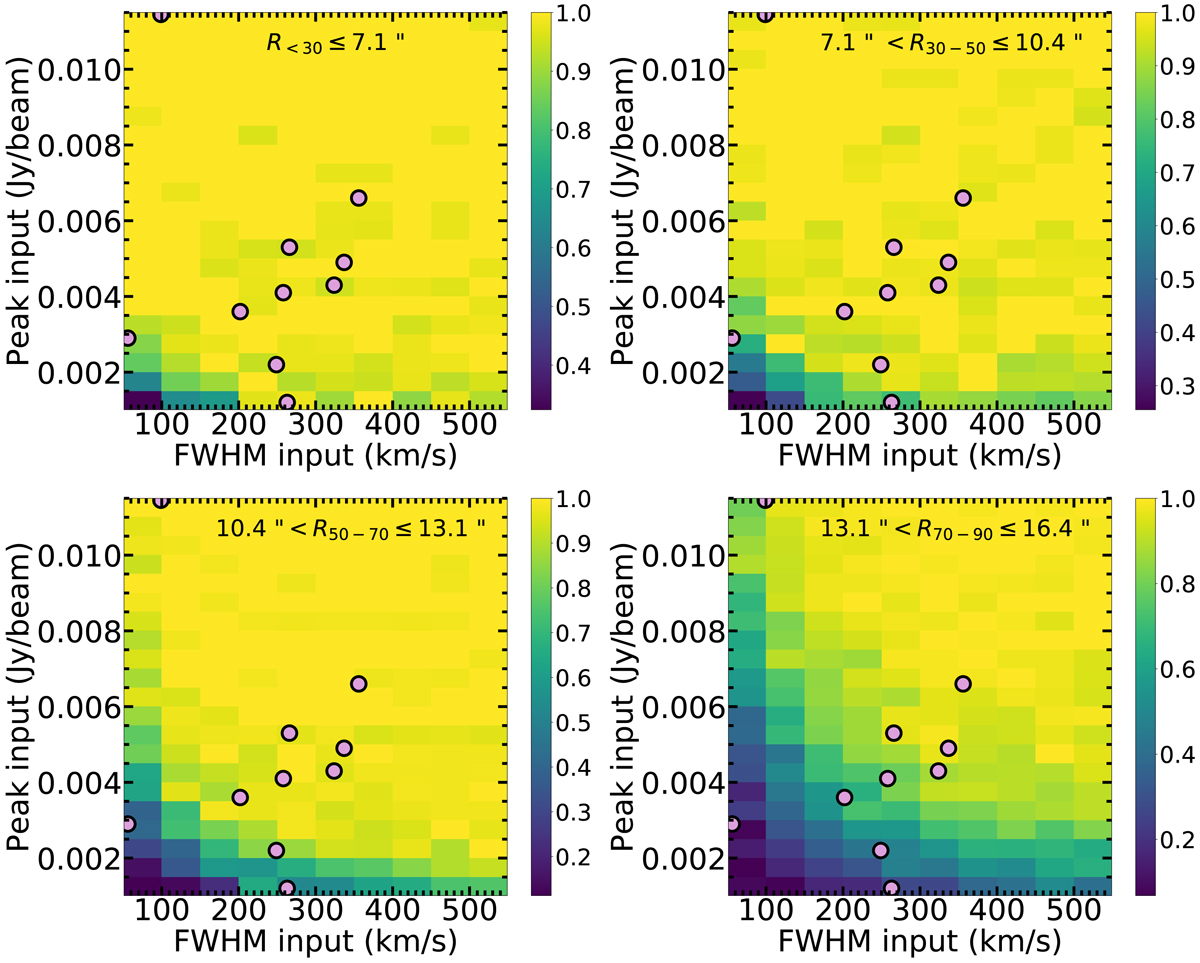
Completeness (color scale) as a function of the flux peak and the FWHM of a line. The four diagrams correspond to the R< 30, R30−50, R50−70, and R70−90 regions respectively. As is evident from their comparison, the completeness is a strong function of the line location in the FOV because of the degrading sensitivity from the phase center to larger radii. The lines used to build the [C II] LF (see Sect. 5) are also shown (filled circles), except for the two brightes ones (i.e., S848185 and S842313), which are located outside the plotted ranges and have completeness equal to 1 everywhere in the FOV. We show the [C II] serendipitous detections in all the panels, independently from the line location in the FOV, since we computed their completeness in each ring when building the LF (see Eq. (3)).
Current usage metrics show cumulative count of Article Views (full-text article views including HTML views, PDF and ePub downloads, according to the available data) and Abstracts Views on Vision4Press platform.
Data correspond to usage on the plateform after 2015. The current usage metrics is available 48-96 hours after online publication and is updated daily on week days.
Initial download of the metrics may take a while.