Fig. 2.
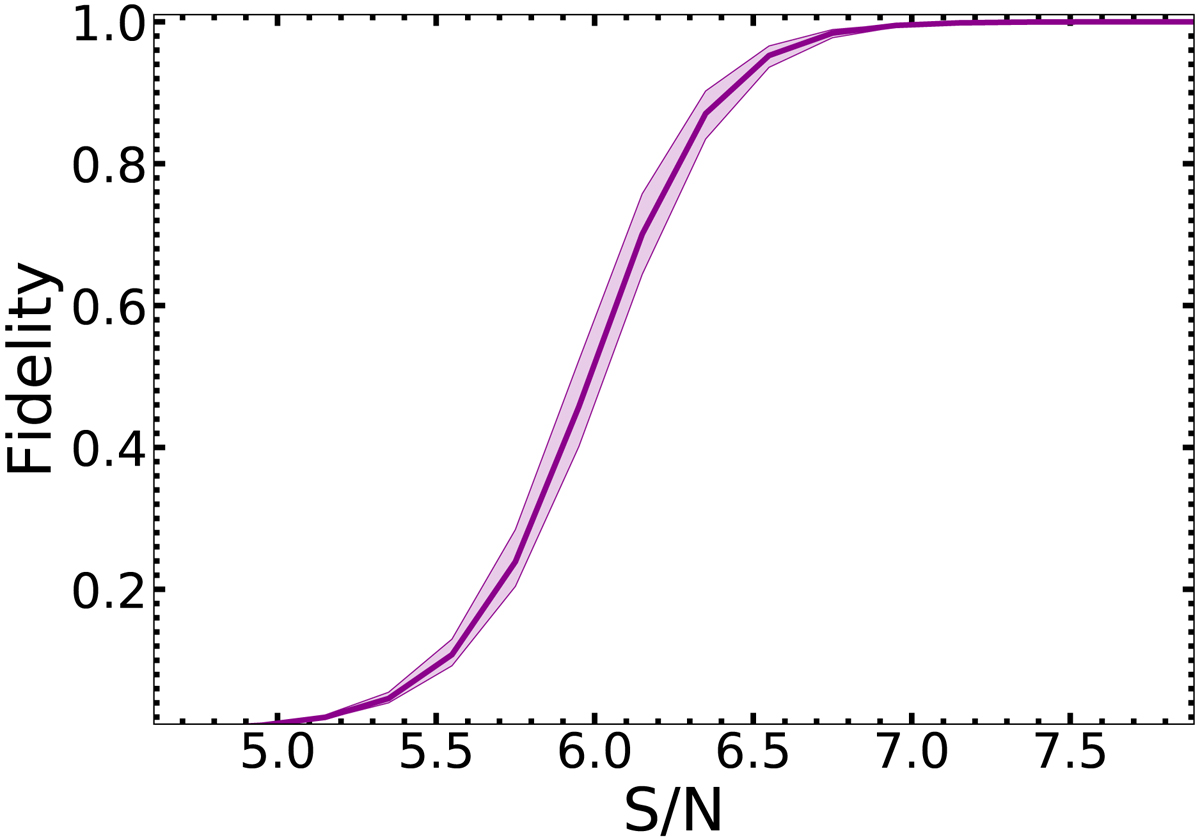
Fidelity curve (purple solid line) for the serendipitous lines detected in ALPINE. The shaded area corresponds to the 1σ errorbars. The fidelity was computed by comparing the number of positive (genuine lines and noise peaks) and negative (only noise) peaks detected in the 118 ALPINE pointings. We see that the fidelity is a very steep function of the S/N. We adopted a fidelity threshold of 85% (corresponding to a S/N cutoff of 6.3) for the final catalog of the serendipitous lines.
Current usage metrics show cumulative count of Article Views (full-text article views including HTML views, PDF and ePub downloads, according to the available data) and Abstracts Views on Vision4Press platform.
Data correspond to usage on the plateform after 2015. The current usage metrics is available 48-96 hours after online publication and is updated daily on week days.
Initial download of the metrics may take a while.