Fig. A.1.
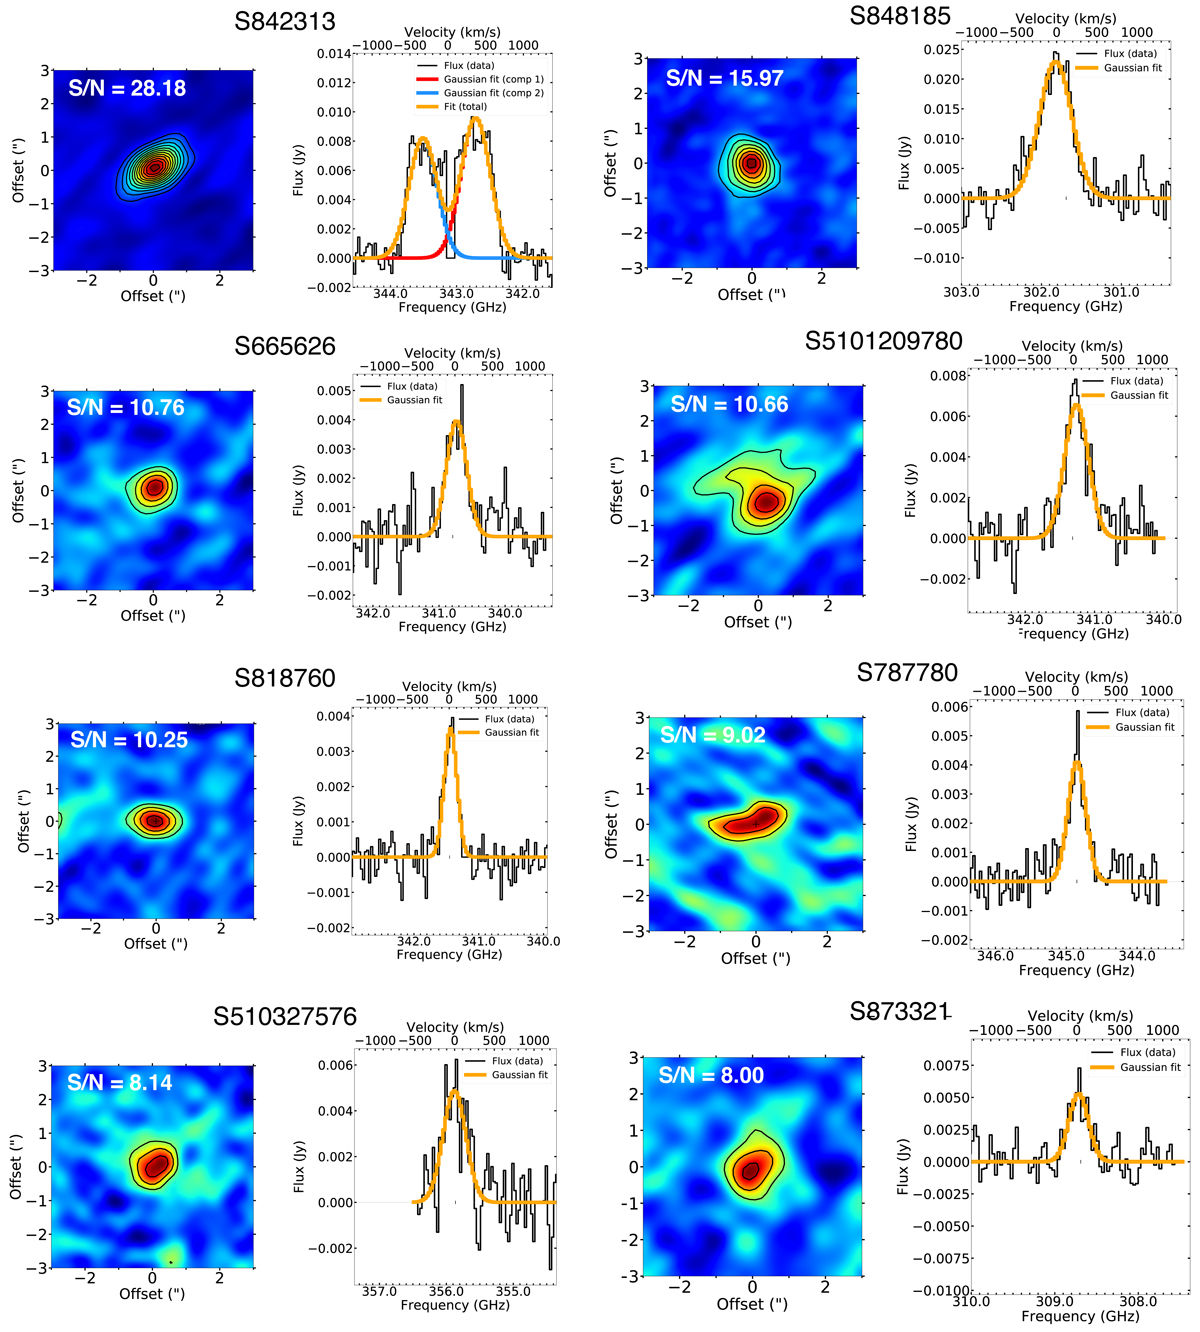
Continumm-subtracted ALMA maps and spectra of the 14 serendipitous lines found in the 118 ALPINE pointings. Each panel is labeled according to the number of the ALPINE source in the same pointing. We report the contours in steps of 2σ. The lowest level corresponds to 3σ. We fitted the line emission (black) using a sigle Gaussian component (orange). In the case of S842313, we fitted the line profile using two Gaussian components (cyan and red); the total model is shown in orange. For S5100822662, the serendipitous source is the small blob above the ALPINE target. The blob is marked with a cross and we present a spectrum extracted from its peak spaxel.
Current usage metrics show cumulative count of Article Views (full-text article views including HTML views, PDF and ePub downloads, according to the available data) and Abstracts Views on Vision4Press platform.
Data correspond to usage on the plateform after 2015. The current usage metrics is available 48-96 hours after online publication and is updated daily on week days.
Initial download of the metrics may take a while.